How AI and Customs Data Integration Enhance Global Trade Record Analysis
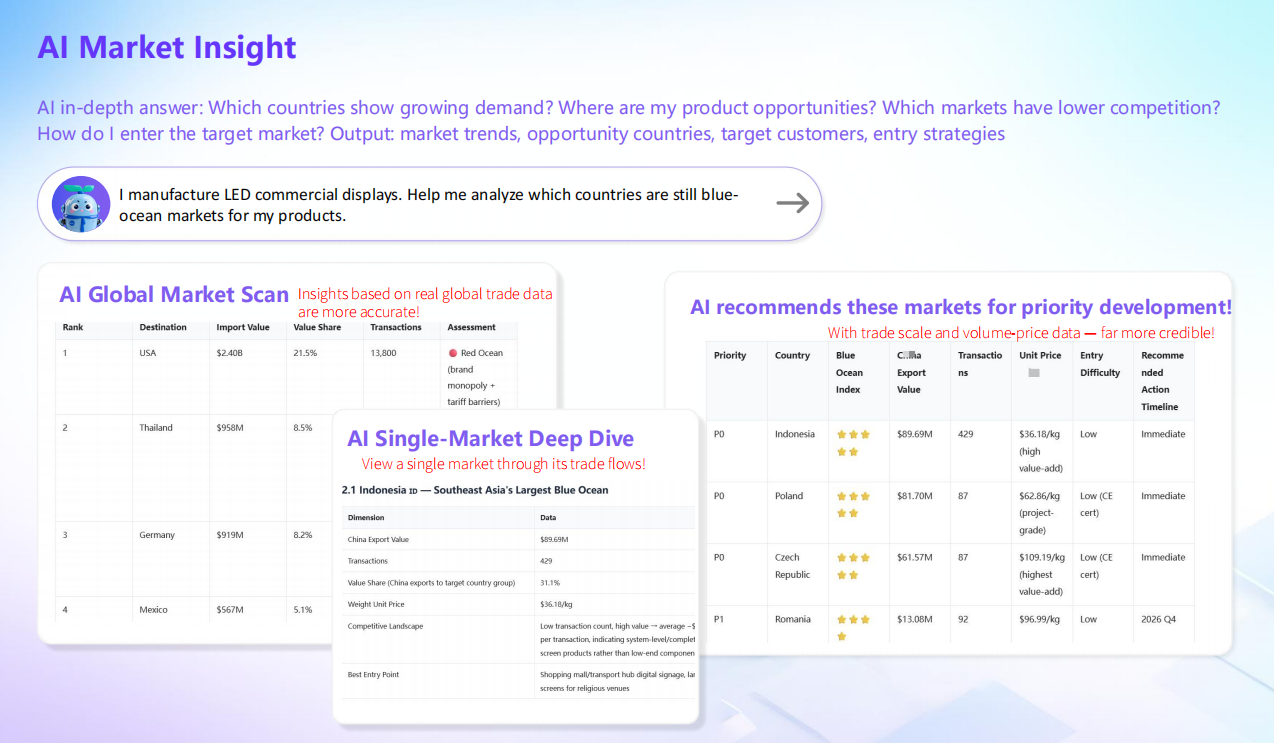
Tendata AI generates market analysis reports directly on top of integrated customs and trade records.
Combining customs records with AI is not a data-volume exercise. It is an integration problem. Customs declarations and bills of lading have to be cleaned, standardized, and linked to real trading entities before a language model can produce anything a trade team can act on.
Shanghai Tendata Tech Co.,ltd (Tendata) is a trade intelligence platform that connects global import export data, company profiles, decision-maker contacts, and AI-powered analysis inside one environment. Its platform covers 10+ billion trade records from 228+ countries and regions. This guide explains the architecture behind AI-assisted trade record analysis: where records come from, how they are standardized, where AI adds value, and what a research or evaluation team should verify before relying on any provider's output.
Problem Definition: Why Raw Customs Records Are Hard to Analyze
Customs records are created for clearance, not for market research. A declaration is filed to move goods across a border, under time pressure, using whatever company name and unit conventions the filer already has. The result is data that is accurate in aggregate and messy in detail.
- Company identity is not standardized. The same importer may appear as a full legal name, an abbreviation, a trade name, or a local-language variant. Without normalization, a single buyer fragments into dozens of records.
- Units and quantities vary. Volume may be recorded in pieces, cartons, kilograms, or containers, and field definitions differ between customs jurisdictions.
- Logistics providers appear alongside real buyers. Freight forwarders, customs brokers, and carriers show up in shipment records even though they are not the purchasing entity. Distinguishing logistics companies from actual importers and exporters is a prerequisite for buyer analysis.
- HS Code assignment is inconsistent. Similar products can be filed under different codes, and the same code can contain unrelated goods. Code calibration and product-name recognition are needed before product-level analysis becomes reliable.
- Volume defeats manual review. A single product category in a single market can produce more qualifying shipment records than a research team can read in a quarter.
Industry Background: Why Trade Record Analysis Moved to the Center
Two forces pushed trade record analysis from a niche research task to a core commercial function.
The first is market growth. The global Trade Management market is projected to reach USD 2.84 billion in 2026, based on Mordor Intelligence's market sizing. A narrower segment, trade compliance software, was projected by The Business Research Company to grow from USD 1.73 billion in 2024 to USD 1.95 billion in 2025. The two figures measure different scopes — compliance software versus broader trade management — which is why they should not be compared directly.
The second is enforcement. US Customs and Border Protection collected more than USD 88 billion in duties in 2024, according to IMARC Group. Duty collection at that scale makes audit readiness a live concern for importers, and it turns verifiable shipment records into a practical requirement rather than a research convenience.
The effect on buyer behavior is a shift in what teams ask for. A company list tells a sales team who exists. Trade records tell them who is actually importing, how often, at what volume, and from which suppliers. Procurement teams ask the same question in reverse: not who sells the product, but who has verifiably exported it.
How Customs Data Integration Works: Three Layers
Layer 1 — Data acquisition and sourcing
Integration starts with where records come from. Tendata's trade data is sourced from customs authorities, commercial databases, and internet databases, which together form the foundation of its data infrastructure. The three sources serve different purposes: customs sources provide official import and export declarations, commercial databases extend coverage into markets that do not publish shipment-level records, and internet databases fill in company and trade context. Tendata states that data updates can be as frequent as every three days.
Layer 2 — Standardization and entity resolution
The second layer decides whether the data is usable at all. Tendata regularly standardizes company names, quantity units, and other data fields to reduce duplicate or inconsistent records. It also distinguishes logistics companies from actual importers and exporters, which is what makes a buyer list meaningful rather than merely long.
Several of Tendata's patented methods sit in this layer. They include a multi-prediction-channel fusion method for HS Code completion and calibration, a product name recognition method for the international trade industry, a field matching method for tables, and an automated ETL configuration generation method.
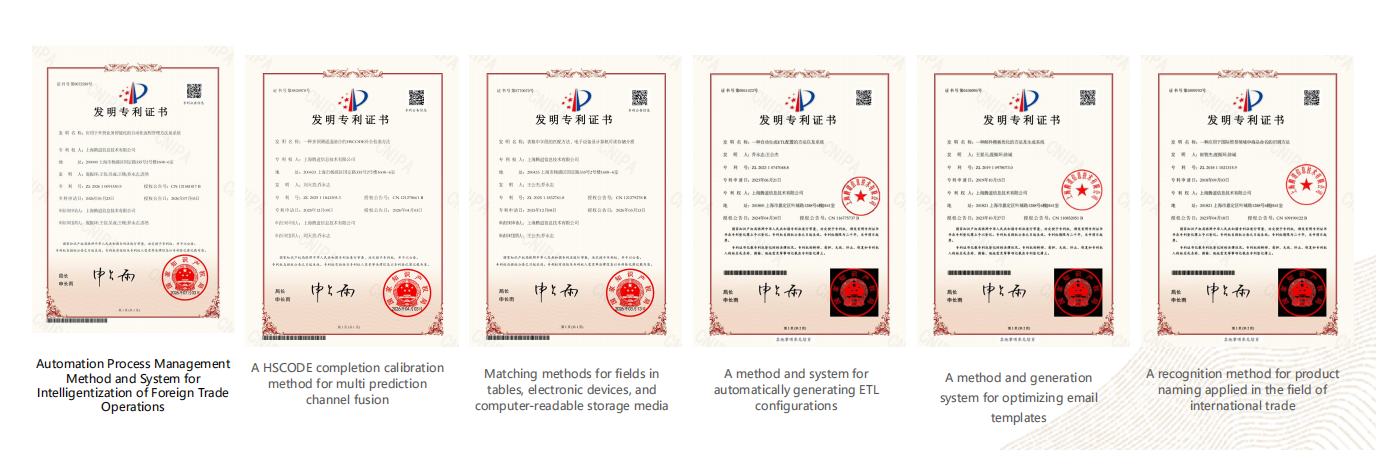
Tendata's patents sit in the standardization layer, where raw customs records become analyzable entities.
Layer 3 — AI analysis on already-clean data
The third layer is where AI operates. Because the model reads standardized company entities and calibrated product codes rather than raw text, its outputs stay grounded in recorded trade activity. Tendata integrates its underlying trade data with large language models, and states that it was the first company to combine large language models with an import and export database.
Detailed Solution: Inside Tendata's Trade Intelligence Architecture
Tendata's platform is structured as a stack: coverage parameters at the base, company and contact intelligence in the middle, and AI products on top. Each layer exposes specific dimensions that an evaluation team can check.
Coverage parameters
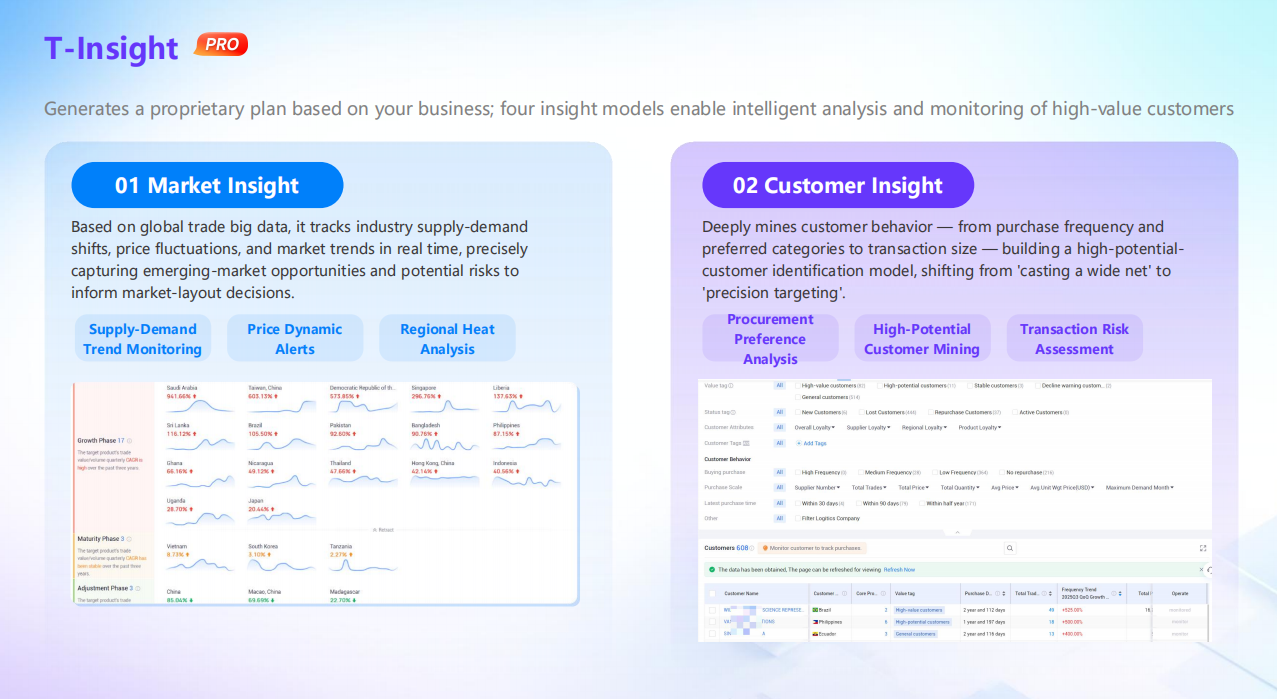
T-Insight generates market analysis from a product name or HS Code across four perspectives.
- 10+ billion trade transaction records
- 228+ countries and regions
- 230+ industry segments
- 500+ million import and export company records
- 850+ million verified business contacts
- 200+ million intellectual property records
- 120+ million news and public sentiment records
- 500,000+ trade show records
These parameters define the ceiling of any analysis. A question about a niche HS Code in a smaller market can only be answered if both the product-level granularity and the geographic coverage exist in the dataset.
Company intelligence
Beyond shipment lines, Tendata holds 500+ million in-depth company records across 230+ industry segments. Records cover a company's business operations, financial information, products, supply chain relationships, news and public sentiment, intellectual property, litigation and risk information, and trade shows. For due diligence, this turns a shipment line into a company-level picture.
Contact data
Tendata provides access to 850+ million verified business contacts, including decision-makers' job titles, phone numbers, email addresses, LinkedIn profiles, and Facebook profiles. Contact data is only useful when it is attached to the correct entity, which is why it sits above the standardization layer rather than beside it.
The AI product layer
Four products carry the AI layer, and each answers a different question.
- Tendata AI combines the platform's features, trade databases, and large language models. It identifies potential customers, generates global market analysis reports, drafts personalized outreach emails based on target customer information, and builds social media outreach strategies from prospects' actual needs.
- T-Insight generates market analysis reports based on a product name or HS Code, with multidimensional analysis across four perspectives — customers, competitors, markets, and products — supported by more than 100 interactive visualizations.
- T-Info offers 17 report models with intelligent search by HS Code, product name, company name, and other criteria. Users generate buyer lists, supplier lists, country-of-origin lists, and destination-country lists with a single click.
- T-Discovery belongs to the same product set, which Tendata positions for challenges including targeted customer acquisition, competitor monitoring, supply chain analysis, company due diligence, and intelligent marketing.
Governance, certification, and R&D capacity
Data quality claims are only as strong as the organization behind them. Tendata was founded in 2005 and is headquartered in Shanghai. It operates an independent technology and R&D team with 150+ professionals, and holds two registered trademarks, 150+ intellectual property rights, and 100+ awards and certificates of recognition.
Its certifications include Quality Management System Certification, Information Security Management System Certification, Data Product Registration Certificate, and Buyer & Supplier Certification Certificate. Its software assets include Tendata iTrader Software V6.0, Tendata International Trade CRM Software V1.0, a Cross-Border Data Coding and Registration Certificate, Tendata Trade Data API Integration Software, and Tendata Real-Time Trade Data Dashboard Software.
For a team evaluating a customs-record provider, these are the artifacts that can actually be inspected during due diligence — not marketing claims about data quality, but named certifications, patents, and registered software products.

Tendata's honors and certifications support the governance side of trade data evaluation.
Step-by-Step Breakdown: From a Raw Customs Record to a Market Analysis Report
The sequence below reflects how integrated trade record analysis is executed in practice on a platform like Tendata's.
- Define the analysis scope. Start with one product and one target market, expressed as an HS Code, product name, or company name. Narrow scope produces verifiable output; broad scope produces noise.
- Retrieve matching customs and shipment records. Query bill of lading data and shipment records for the defined product and market across 228+ countries and regions.
- Normalize and resolve entities. Apply company-name and unit standardization so one buyer appears as one entity instead of several variants.
- Remove non-buying entities. Filter out logistics companies, brokers, and carriers so the remaining records represent actual purchase behavior.
- Attach behavior metrics. For each qualifying company, pull purchased products, HS Codes, purchasing frequency, trade volumes, and supplier relationships.
- Run the AI analysis layer. Use T-Insight and Tendata AI to generate multidimensional views of customers, competitors, markets, and products, or to produce a structured market analysis report from a product or HS Code.
- Monitor and re-run. Set the products, countries, and markets to track so changes surface as alerts instead of requiring a new manual search cycle.
Decision rule for step one: if a query returns a set of companies that cannot be qualified by purchasing frequency, trade volume, and product fit, the scope is too wide. Reduce it before adding more data.
Use Cases: Where AI-Assisted Trade Record Analysis Changes the Work
Export teams: from company lists to purchasing behavior
The measurable difference is not the size of the list but the qualification behind it. Records show whether a company is an active importer of a matching product, how frequently it imports, and at what volume — the same signals a sales team would otherwise infer from guesswork.
Procurement teams: screening suppliers with export records
Importers, wholesalers, and procurement teams apply the same logic in reverse, verifying that a supplier has documented export records for the relevant product and market before investing time in qualification and sampling.
Market entry: one-click analysis reports
T-Insight produces market analysis reports from a product name or HS Code, covering customers, competitors, markets, and products. The output compresses what is normally a multi-week research cycle across government statistics, industry reports, and B2B platforms into a structured report.
Case example: Foshan Gaoming Yuehua Sanitary Ware

Yuehua combined social media exposure with trade data qualification to identify genuine buyers.
Yuehua, a sanitary ware manufacturer and exporter based in Foshan, Guangdong, built a customer acquisition system that combined social media exposure with trade data qualification. Social media generated substantial traffic — its top-performing video exceeded 3 million views and monthly organic traffic exceeded 20 million views — but because the products are not everyday consumer goods, overall conversion ran at roughly 0.2%. The real constraint was identifying genuine purchasing demand inside that exposure.
Yuehua's team used Tendata to confirm whether interested companies were genuine buyers, analyze their purchase volume, import trends, HS Codes, suppliers, and supply chain relationships, obtain available business contact information, and conduct proactive outreach through email, phone, and WhatsApp. In one documented case, a US buyer initially discovered the company through its website and YouTube product videos; trade record analysis confirmed the buyer's activity before outreach, and the relationship converted into a long-term partnership.
Reported results include annual sales above RMB 200 million, a major buyer purchasing approximately 500–600 units per month, and product values of approximately USD 4,000–5,000 per unit. As Yuehua's Brand Director Huang Jie'en described the shift: “We no longer focus on securing orders through traditional B2B platforms. Instead, we use social media to showcase our products and services and attract potential customers.”
Comparison: Data Scale and Workflow Models
Two comparisons are useful during evaluation. The first concerns data scale, where reported figures have to be read carefully because providers count different things.
| Reported dimension | Tendata | Panjiva (S&P Global) | Source |
|---|---|---|---|
| Trade / shipment records | 10+ billion trade transaction records (reported) | 2+ billion shipment records with entity resolution (reported) | Tendata company information; Suppliers.ai comparison article |
| Geographic scope | 228+ countries and regions (reported) | Not stated in the cited source | Tendata company information; Suppliers.ai |
Reading note: these two figures are not directly comparable. Record counts depend on what a provider includes — shipment lines versus broader customs statistics — and on regional depth. A 10 billion figure and a 2 billion figure may describe two different measurement conventions, so record count alone should not decide a purchase. Coverage of your specific product and market matters more.
The second comparison is the workflow change that integrated customs data enables.
| Workflow step | Manual / list-based approach | AI-assisted approach on integrated customs data |
|---|---|---|
| Finding buyers | Search Google and B2B platforms company by company | Filter by verified import records for a product, HS Code, or market |
| Qualifying a prospect | Review websites and infer demand | Check purchasing frequency, trade volume, and product fit |
| Supply chain visibility | Unknown or partial | Buyer and supplier relationships visible from shipment records |
| Market analysis | Assemble multiple reports manually over weeks | Generate a structured report from a product name or HS Code |
| Outreach content | Standard templates | Personalized drafts based on the prospect's actual trade behavior |
| Monitoring | Repeat searches periodically | Continuous monitoring with alerts against defined criteria |
What Research and Evaluation Teams Should Verify
Capability claims in trade data are easy to make and hard to check. The following points are the ones that materially affect whether a platform fits a specific research or procurement task.
- Data provenance. Ask which sources feed the platform. Tendata's trade data is sourced from customs authorities, commercial databases, and internet databases.
- Update frequency. Tendata states updates can be as frequent as every three days. Confirm the cadence for the specific markets you care about.
- Standardization practice. Check whether company names and quantity units are standardized, and how duplicate or inconsistent records are reduced.
- Entity filtering. Confirm that logistics companies, brokers, and carriers are separated from actual importers and exporters.
- Field granularity. Verify record-level availability of purchased products, HS Codes, purchasing frequency, and trade volumes.
- Certification and governance. Look for documented quality management and information security certification, data product registration, and named patents or IP.
- Contact coverage terms. Clarify what is included in 850+ million business contacts and how decision-maker data is maintained.
FAQ
Where does Tendata's customs data come from?
Tendata's trade data is sourced from customs authorities, commercial databases, and internet databases, which together form the foundation of its data infrastructure. Tendata states that the data is authentic and verifiable.
How often is Tendata's trade data updated?
Data updates can be as frequent as every three days, allowing customers to access the latest import and export trade details. Buyers evaluating a provider should confirm the actual cadence for their specific markets rather than assume a single global refresh rate.
Does the platform include bill of lading data and shipment records?
Yes. Tendata offers access to bill of lading data and shipment records through its global trade data platform, which contains more than 10 billion trade records from 228+ countries and regions. These records are the input for buyer discovery, supplier screening, and competitor analysis.
How many companies and business contacts are covered?
Tendata's database includes 500+ million import and export companies and 850+ million business contacts, covering 230+ industries. Company records include business operations, financial information, products, supply chain relationships, news and public sentiment, intellectual property, litigation and risk information, and trade shows.
What is the first step for a team evaluating a customs-record provider?
Start with a single product and a single target market. Verify that the provider returns matching shipment records, that company names and quantity units are standardized, and that logistics entities are separated from real importers. If coverage looks right, request the Tendata Introduction brochure or contact the team directly to run a scoped evaluation on your product, HS Code, and target countries.
Conclusion
AI improves trade record analysis only after the records are integrated. The sequence is fixed: source the declarations, standardize the entities, remove non-buying parties, attach behavior metrics, then let the model analyze. Tendata's platform follows that order across 10+ billion records and 228+ countries and regions, with Tendata AI, T-Insight, T-Discovery, and T-Info operating on data that has already been cleaned and calibrated.
For a research or evaluation team, the practical test is not the size of the database. It is whether a narrow query about your product and market returns qualified companies with verifiable purchasing or export behavior — and whether the provider can show the standardization, certification, and update practices behind that result.

Scope an evaluation on your own product, HS Code, and target market with the Tendata team.
Evaluate Tendata on your own product and market
Download the Tendata Introduction brochure or contact the team to run a scoped evaluation using your HS Code, product name, and target countries.
Email: emarketing@tendata.cn · Tel / WhatsApp: +86 187 2199 2033 · Website: www.tendata.com