
Solar Energy Storage vs. Diesel Power: A 2026 Cost and Performance Comparison for Home and Industrial Buyers
At the procurement decision stage, buyers are not just comparing battery brands. They are choosing between two energy architectures: continuing with fossil-fuel-based power or switching to a solar energy storage system. A solar energy storage system (ESS) combines PV generation, battery storage, and intelligent control in an integrated solution. Traditional fossil fuel power systems rely on ongoing fuel supply and separate power-management equipment. This article compares the two on efficiency, total cost of ownership (TCO), maintenance, and risk, using 2026 market data and manufacturer-level system data.
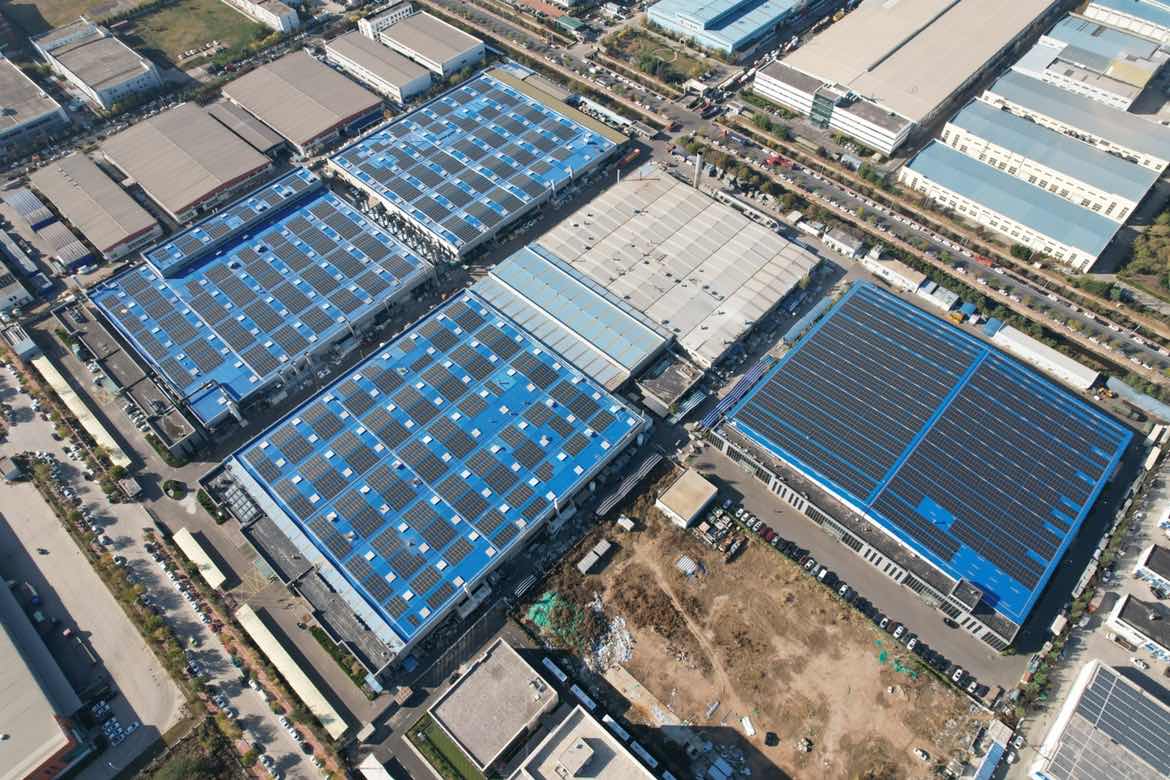
The Decision Problem: Purchase Price vs. Lifecycle Cost
The main difficulty in comparing solar ESS with fossil fuel power is that the purchase price can mislead a buyer. Solar systems have a higher initial cost. The real decision metric is lifecycle cost: fuel, maintenance, spare parts, labor, downtime, and replacement intervals. A buyer who compares only the invoice may conclude solar is more expensive. A buyer who models five years of operation will often reach the opposite conclusion, because the solar system avoids continuous fuel consumption and requires far less maintenance.
Efficiency differences also matter. A solar ESS does not simply generate electricity; it stores surplus power and releases it when needed. That combination can raise usable energy output per installed unit of capacity and reduce dependence on grid or diesel backup.
Solar Energy Storage Market Context in 2026
Market data shows why this comparison is urgent. Grand View Research estimated global cumulative installed energy storage capacity at 768.5 GW in 2025, projected to reach 931.7 GW in 2026. Fortune Business Insights projected the global solar energy storage battery market at USD 7.84 billion in 2026, with a 28.93% compound annual growth rate through 2034. The Asia-Pacific region held 48.0% of energy storage system revenue in 2025, led by China, according to Grand View Research. China's lithium-ion battery exports were projected at USD 77 billion in 2025, based on China Customs data cited by Liberty Street Economics.
For residential and industrial buyers, the decision is not limited to technology. Market concentration matters. Global Market Insights reported that the top five residential solar storage suppliers held a combined 39.5% market share in 2025. High concentration makes supplier due diligence more important, not less.
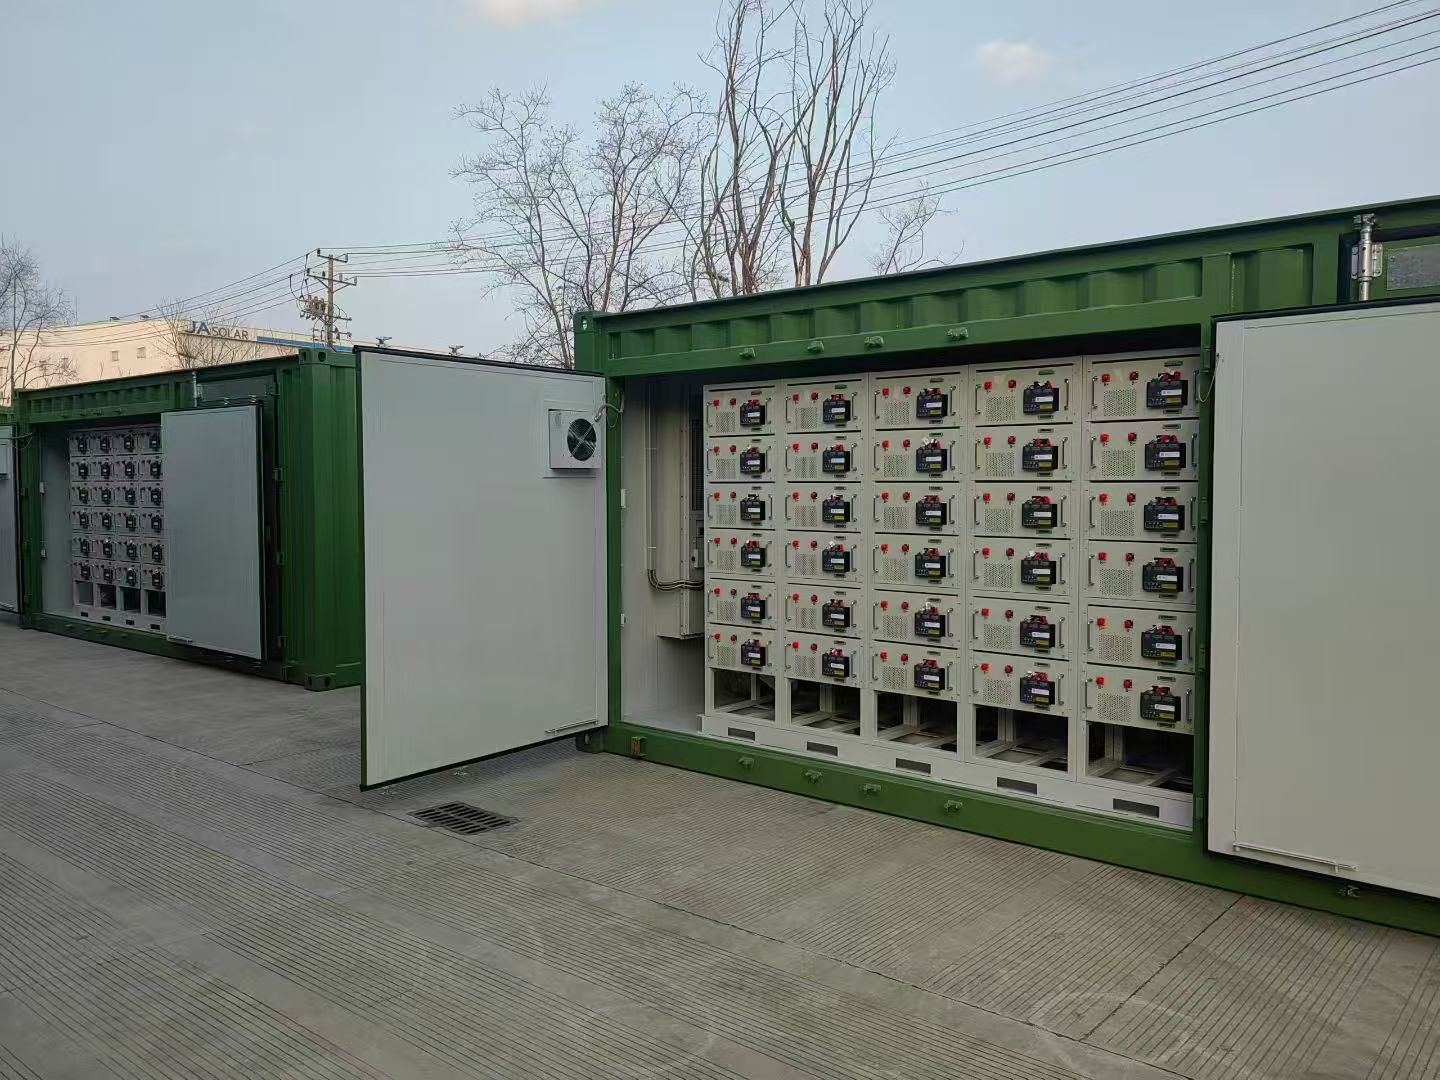
Solar ESS vs. Traditional Fossil Fuel Power: The Comparison
The decision framework is to evaluate a solar ESS as a complete replacement for fossil fuel generation, not as a battery add-on. The table below summarizes the documented comparison between a solar ESS and a traditional fossil fuel power generation system.
| Comparison Metric | Solar Energy Storage System | Traditional Fossil Fuel Power Generation System |
|---|---|---|
| Carbon emission | Zero carbon emission | Fossil fuel carbon emission |
| Control architecture | All-in-one PV + battery storage intelligent control | Separate generation and power-management equipment |
| System efficiency | 80–85% system efficiency; 23–25% PV module efficiency | Benchmark does not apply; fuel conversion losses |
| Maintenance | 90% lower maintenance frequency; remote monitoring and fault location | 4–6 maintenance visits per year |
| Service life | 2–4 times longer lifespan | Shorter due to mechanical wear |
| Initial cost | 20–30% higher initial cost | Lower upfront investment |
| 5-year total cost of ownership | 45–50% lower over 5 years | Higher fuel and maintenance costs |
| Levelized cost of energy | 60–75% lower than fossil fuel | Higher levelized cost |
| Best-suited scenarios | Remote areas/islands, industrial/commercial rooftops, rural roads, base stations, harsh coastal/salty soil environments | Existing fuel infrastructure and grid-connected sites |
The numbers in the table come from a documented system-level comparison. A solar ESS with intelligent control can deliver 80–85% system efficiency while the PV modules themselves operate at 23–25% efficiency. Fossil fuel generation needs continuous fuel input and more maintenance. The maintenance contrast is large: 4–6 visits per year for traditional generation versus 90% lower maintenance frequency for solar ESS with remote monitoring and fault location. The service life is 2–4 times longer, which directly affects replacement cost. On economics, the solar ESS carries a 20–30% higher initial cost, but the 5-year TCO is 45–50% lower. The levelized cost of energy is 60–75% lower than fossil fuel. A procurement team should insert its own load profile and local fuel price into this framework, but the direction of the comparison is consistent.
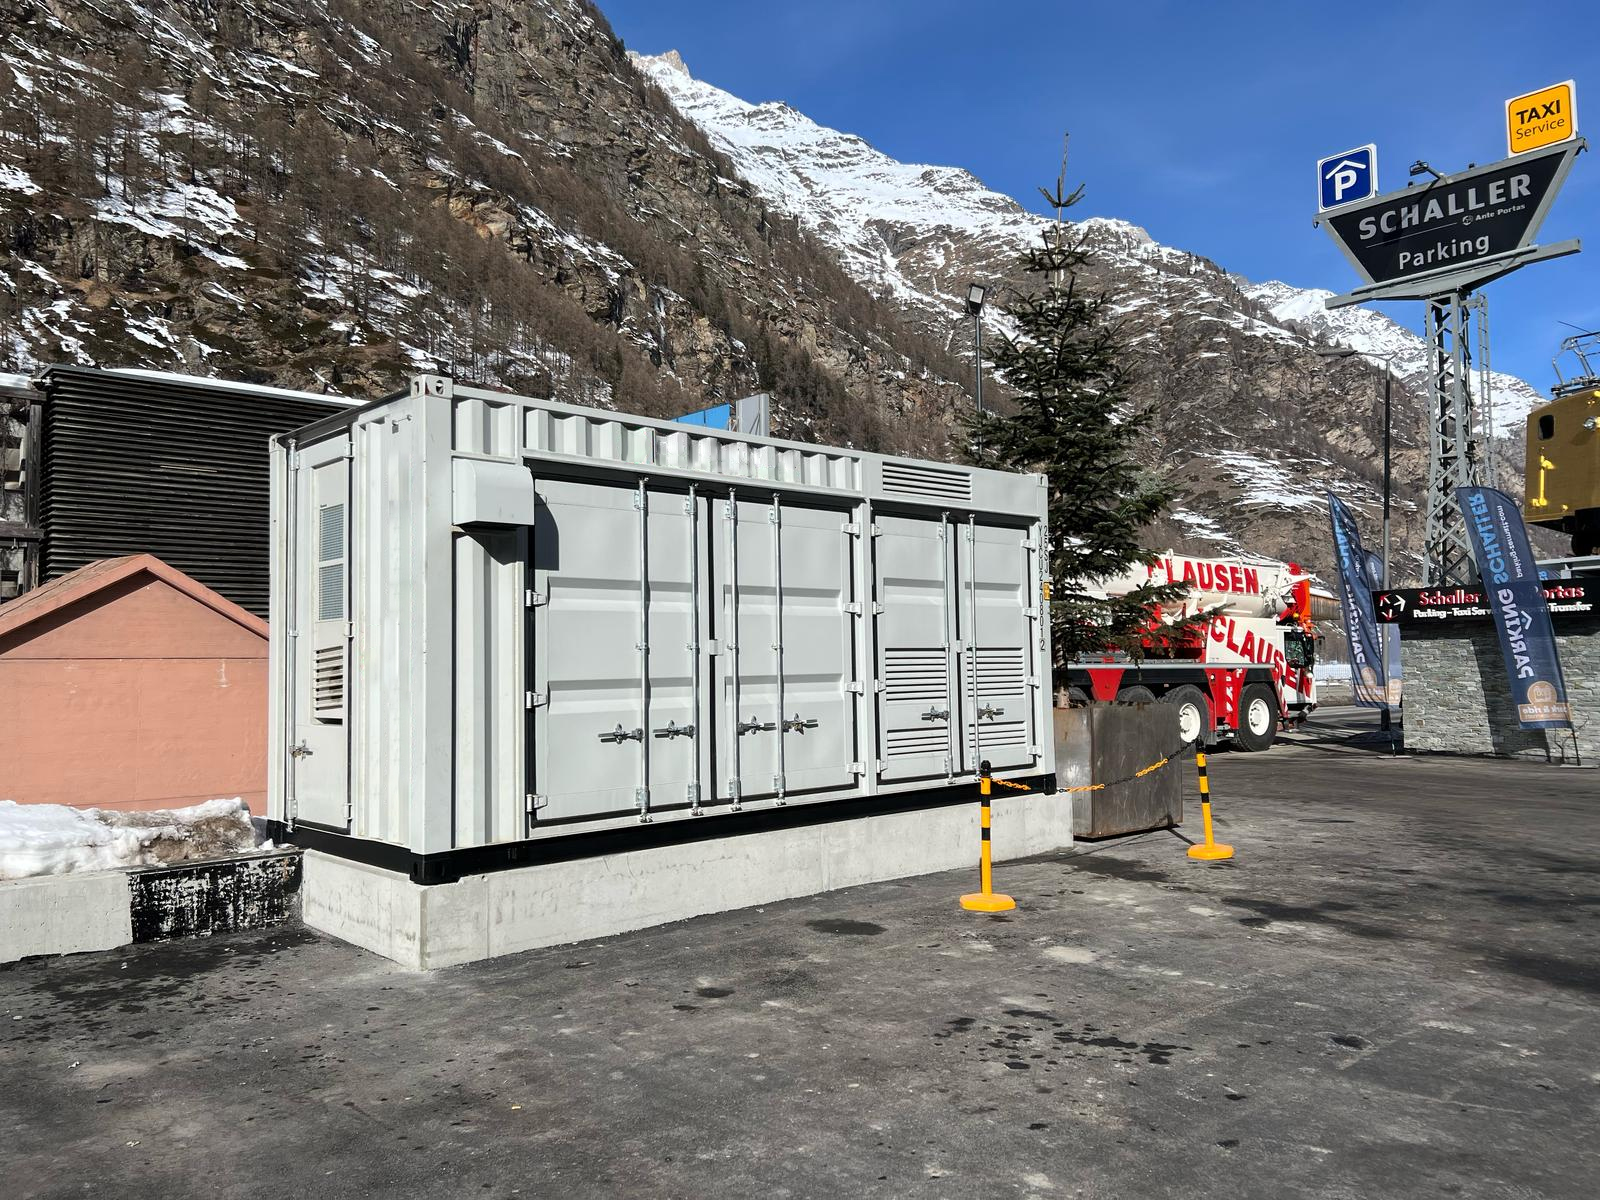
How to Compare Systems Before Purchase: A 5-Step Process
Step 1: Define the load profile and backup requirement
Calculate the continuous load, peak power, and required backup hours. This directly determines the solar array size, battery capacity, and inverter rating. A system designed around real load data will always beat a system selected by intuition.
Step 2: Build a 5-year TCO model
Include fuel, maintenance, spare parts, labor, downtime, and anticipated replacement intervals. Compare the solar ESS against the fossil fuel baseline using local electricity or diesel prices. The documented comparison shows a 45–50% lower 5-year TCO for solar ESS after a 20–30% higher initial purchase price.
Step 3: Verify efficiency parameters
Check the PV module efficiency and the whole-system efficiency. The reference data shows 23–25% PV module efficiency and 80–85% system efficiency. These parameters affect how much energy the system can deliver and how much space is needed.
Step 4: Assess maintenance and remote monitoring
For remote or distributed sites, maintenance frequency is a major operating cost. A solar ESS with remote monitoring and fault location can reduce maintenance frequency by 90% compared with traditional generation. The supplier should explain how faults are detected and who responds first.
Step 5: Inspect site-risk mitigation
For coastal, saline, or lightning-prone sites, confirm that the system includes waterproofing, corrosion protection, and surge protection. Protection features such as overcharge/discharge protection, temperature control, IP67 waterproof design, lightning protection, and AFCI arc fault protection should be part of the specification, not optional extras.
Where Solar ESS Delivers the Strongest Return
Different buyers see different returns, but several scenarios produce a clear advantage for solar energy storage:
- Remote areas and islands: Fuel delivery is costly and unreliable. A solar ESS removes ongoing fuel logistics and lowers the levelized cost of energy.
- Industrial and commercial rooftops: On-site solar generation with storage reduces grid dependence, peak demand charges, and production downtime exposure.
- Rural roads: Lighting, traffic monitoring, and signalling can operate from an off-grid solar power system without trenching or grid extension.
- Base stations: Telecom and monitoring base stations need dependable backup power. Solar ESS provides automatic backup without diesel refuelling.
- Coastal and saline environments: Harsh coastal or salty soil conditions require weatherproof system design. IP67 waterproofing and corrosion-resistant enclosures reduce failure risk.
Managing the Operational Risks of Solar Energy Storage
Replacing an energy source introduces operational risk that must be managed. The primary documented risks include battery overheating, PV module power degradation, water ingress, short circuit and electric leakage, thermal runaway, and structural failure. A reputable supplier designs countermeasures into the system: overcharge/discharge protection, temperature control, IP67 waterproof design, lightning protection, and AFCI arc fault protection. The manufacturer should also provide real-time system monitoring, regular maintenance service, quality control, an emergency response plan, and compliance certification. Buyers should verify these protection layers before purchase, not after installation.
FAQ
What certifications does a solar energy storage system need for the EU market?
According to TÜV SÜD, solar energy storage systems entering the EU market must comply with IEC 62619 for lithium battery safety and EN 62040-1 for general system safety. Chinese supplier VLAND (Vland International Ltd.) holds CE, TUV, IEC, and BIS certifications. Buyers should request project-specific certification copies before placing an order.
Can VLAND supply a complete solar energy storage system including inverter and battery?
Yes. VLAND's product line includes off-grid solar systems, on-grid solar systems, hybrid solar systems, energy storage batteries, ESS battery packs, solar inverters, lithium batteries, solar panels, and BIPV. This lets a distributor or system integrator source the whole ESS architecture from one supplier with a single compliance and warranty path.
How does the upfront cost and 5-year TCO compare with fossil fuel power?
Documented comparison data shows the solar ESS has a 20–30% higher initial cost but a 45–50% lower total cost of ownership over five years compared with traditional fossil fuel power generation. Maintenance frequency is 90% lower, and service life is 2–4 times longer. The levelized cost of energy is 60–75% lower.
Can VLAND's production capacity support distributor or project orders?
VLAND operates a 7,000 m² factory in Qingdao, China, with an annual output of 43,200 units and a team of 35, including a 5-engineer R&D team. The export ratio is 72%, with main markets in the UAE, Saudi Arabia, Qatar, the UK, the EU, and Cuba. This combination of capacity and export experience supports distributor and project-based procurement.
How can our team get product data and a quotation for the next project?
Download the VLAND company brochure for a full product line overview, then contact the sales team for the latest data sheets, pricing, and lead times. Contact: Inn, email inn@v-land.ltd, phone +86-532-88509986, mobile +86-130-0169-0010, or visit www.v-landenergy.com.
Final Takeaways
On the metrics that matter most to a procurement decision, solar energy storage systems outperform traditional fossil fuel power on lifecycle cost, maintenance frequency, system efficiency, and service life. The 20–30% initial cost premium is offset by a 45–50% lower five-year TCO and a 60–75% lower levelized cost of energy. The remaining risk is supplier capability. A decision-ready buyer should verify certifications, manufacturing capacity, and system-design experience before issuing a purchase order.
Need a system data pack for your procurement model?
Download VLAND BrochureHave Questions or Need More Details?
Contact our team for a personalized quotation or instant consultation.
Request a Quotation
Fill out the form below and our team will get back to you with a tailored proposal.
WhatsApp Direct Chat
Prefer to chat in real-time? Message us on WhatsApp for instant assistance & quick answers.
- Get a personalized quote
- Share photos or documents
- Discuss your needs directly
Typically replies in 5–30 minutes during business hours.