
2026 Lithium-Ion Manufacturing Map: Capacity, Policy, Export
2026 Lithium-Ion Manufacturing Map: Capacity, Policy, Export
Global lithium-ion battery manufacturing in 2026 is best read as three separate regional signals, not one ranking. Asia-Pacific still concentrates cylindrical cell production for 18650 and 21700 formats; the United States has a federal blueprint aimed at building a domestic lithium-battery value chain; and China remains central to battery-mineral processing and trade. For a procurement team at decision stage, those signals affect different parts of the supply chain: cell availability, pack qualification, country-of-origin exposure and long-term sourcing risk.
Demand is not the missing piece. The supplied IEA-sourced estimate values the global lithium-ion battery market at USD 151.0 billion in 2025 and projects USD 405.4 billion by 2033. The drone battery market is estimated at USD 1.65 billion in 2026, while the medical battery market is projected at USD 2.7 billion by 2029 at a 6.2% CAGR. What remains uneven is manufacturing evidence: the same data set does not provide plant-level GWh capacity, utilisation rates or finished-cell customs values. That limits any claim that one region is winning in 2026. It does not prevent a disciplined comparison of what each regional signal proves and what it leaves open.

The 2026 manufacturing picture: demand is visible, capacity is not equally visible
The first decision rule is to separate demand from capacity. Demand-side values are available for the total lithium-ion market and for two application segments. Capacity evidence is narrower. The most specific production figure in the supplied evidence is that Asia-Pacific accounted for nearly 65% of total production of 18650 and 21700 batteries globally in 2024. That is a cylindrical-cell production share, not a share of all lithium-ion cells, not a pack-assembly share and not a 2026 forecast.
Policy evidence is also directional. The U.S. Department of Energy's Federal Consortium for Advanced Batteries published the National Blueprint for Lithium Batteries 2021-2030 to guide investment in a domestic lithium-battery manufacturing value chain. Separately, a peer-reviewed 2023 study describes lithium-based new energy as a strategic emerging industry in many countries, including China. These statements establish policy intent and strategic priority. They do not establish that new capacity is commissioned, qualified or available to buyers in 2026.
Trade evidence has the same boundary. The U.S. Energy Information Administration analyses trade in graphite, lithium and cobalt among China and key global regions, and characterises China as dominating global trade of battery minerals. A secondary policy commentary in the evidence package goes further, stating that China controls processing of most critical battery minerals, including rare earths, lithium, cobalt and graphite. That is an upstream concentration signal. It is not a finished lithium-ion cell export share, and the retrieved material does not include numeric trade values.
Put together, the 2026 picture is not a simple shift of manufacturing from one region to another. It is a stack: mineral processing in one layer, cell production in another, pack assembly and qualification in a third, and policy support around all three. Buyers who compare only country labels will miss which layer their supplier actually controls.
A regional comparison matrix for procurement decisions
The useful comparison is not which region is best. It is which regional signal changes which procurement check. The matrix below compares the supplied evidence at that level. It deliberately avoids a single score because the evidence covers different layers and years.
| Regional signal | What the evidence shows | What it means for a buyer decision | What it does not prove |
|---|---|---|---|
| Asia-Pacific cylindrical cell production | Nearly 65% of global 18650 and 21700 battery production in 2024 | A deep supply base for these formats; buyers can compare cell datasheets and pack assemblers separately | 2026 share, pack capacity, lead times or quality performance |
| U.S. policy roadmap | National Blueprint for Lithium Batteries 2021-2030 guides investment in a domestic value chain | Policy support may improve long-term domestic options; buyers should verify site-level qualification | Commissioned capacity, output, cost or commercial availability in 2026 |
| China-linked mineral processing and trade | EIA: China dominates global trade of battery minerals; secondary commentary: controls processing of rare earths, lithium, cobalt and graphite | Upstream concentration belongs in dual-sourcing and country-of-origin planning | Finished-cell export share, prices or cell-level performance |
| Global demand | Market USD 151.0B in 2025 to USD 405.4B by 2033; drone USD 1.65B in 2026; medical USD 2.7B by 2029 at 6.2% CAGR | Demand supports volume planning and application prioritisation | Regional capacity, supplier capability or product fit |
The matrix also shows why a headline comparison can mislead. A country with policy support may still depend on imported cells or materials. A country with cell production may not have pack-level qualification for a medical or drone programme. A country with mineral processing may not be the final point of export for a finished battery pack.
Export shifts: look at the layer, not the label
The export story in the supplied evidence is primarily a mineral story. The EIA analysis covers graphite, lithium and cobalt trade, and its headline conclusion is China's dominance in battery-mineral trade. The secondary commentary on processing control reinforces the same direction. Neither source provides a finished lithium-ion cell customs value, HS-level export ranking or a 2026 trade forecast. Therefore, the defensible statement is that upstream mineral processing is concentrated, not that finished-cell exports have shifted to a specific new leader.
For buyers, this distinction changes due diligence. A battery pack can be assembled in one market, use cells fabricated in another and contain minerals processed in a third. Country-of-origin planning therefore requires a bill of materials that goes beyond the pack's final assembly address. The evidence package does not supply that bill of materials for any specific supplier. It does show why the question belongs in supplier qualification.
Environmental scrutiny adds another documentation layer. A peer-reviewed 2025 study notes that the environmental consequences of lithium battery production and use have attracted widespread concern. The evidence package does not provide an emission factor, carbon-footprint threshold or recycling-rate benchmark. It does support a practical check: buyers should ask for the environmental documentation that applies to their market and application, and should not infer a numeric ESG score from a general concern statement.
Cost is similarly directional. An IRENA technical paper examines the global lithium industry structure, major players and cost changes. No price, cell cost or landed-cost value was retrieved. Cost comparison therefore remains a data request, not a conclusion. That is important in a decision-stage article: a regional comparison that ends with an unsupported cost ranking is less useful than a checklist that tells the buyer what to request.
Demand signals from specialized applications
The application layer is more active than the regional-capacity layer. The drone battery market is estimated at USD 1.65 billion in 2026. The evidence package also flags a separate USD 3.8 billion estimate with different scope, likely reflecting different drone categories or system boundaries. The two figures should not be averaged or treated as interchangeable. For procurement, the 1.65 billion figure is a segment-size signal, not a supplier benchmark.
The medical battery market is projected at USD 2.7 billion by 2029 at a 6.2% CAGR. That projection supports the case for treating medical battery packs as a qualification-intensive category. It does not specify which cell format, chemistry or certification applies to a given device. Those choices remain product- and programme-specific.
Delivery robots, agriculture drones and medical devices are useful examples because they expose different procurement priorities. A delivery robot battery pack may be evaluated on cycle life, BMS behaviour and pack integration. An agriculture drone battery pack may be evaluated on seasonal duty cycles, charging logistics and environmental exposure. A medical battery pack may be evaluated on documentation, traceability and risk controls. These are evaluation scenarios, not claims that the supplied evidence quantifies demand for each segment.
The evidence package does not provide application-level market shares for 18650, 21700, 18500 or 14500 cells. It also does not provide specifications for 18500 or 14500 cells, LiFePO4 12V battery packs or LiPo battery packs. That gap should be stated plainly: format names are not performance evidence. A buyer comparing a 18500 battery, a 12V battery pack or a rechargeable lithium-ion battery pack for a delivery robot or medical device still needs the datasheet, test report and pack-level validation.
Cell format comparison: 18650 and 21700 as decision inputs
One of the few product-level comparisons in the supplied evidence is between 18650 and 21700 cylindrical cells. The comparison lists 18650 at 250 Wh/kg and 21700 at 300 Wh/kg, and notes that 21700 offers 50% higher capacity per cell. Those values are useful for early format screening. They are not a pack-level conclusion.
A 21700 cell can offer higher energy density and capacity per cell in the supplied comparison, but the pack designer must still account for thermal behaviour, mechanical fit, BMS design, cycle life under the actual duty cycle and certification scope. The evidence package does not provide continuous discharge current, cycle life at a stated depth of discharge, operating temperature range or pack-level energy for either format. Buyers should therefore use the 18650-versus-21700 comparison to frame questions, not to declare a winner.
The same discipline applies to the rest of the buyer vocabulary. A 18650 rechargeable battery, a 21700 battery, a LiFePO4 battery, a 12V battery pack, a LiPo battery and a smart robot battery are not interchangeable categories. They differ in chemistry, packaging, BMS and application requirements. The evidence package supports a format-level comparison only for 18650 and 21700. Other categories should be qualified from supplier datasheets and test evidence.
Comparing sourcing strategies, not just regions
At decision stage, the practical comparison is between sourcing strategies. Three strategies can be described from the supplied evidence without declaring a universal winner.
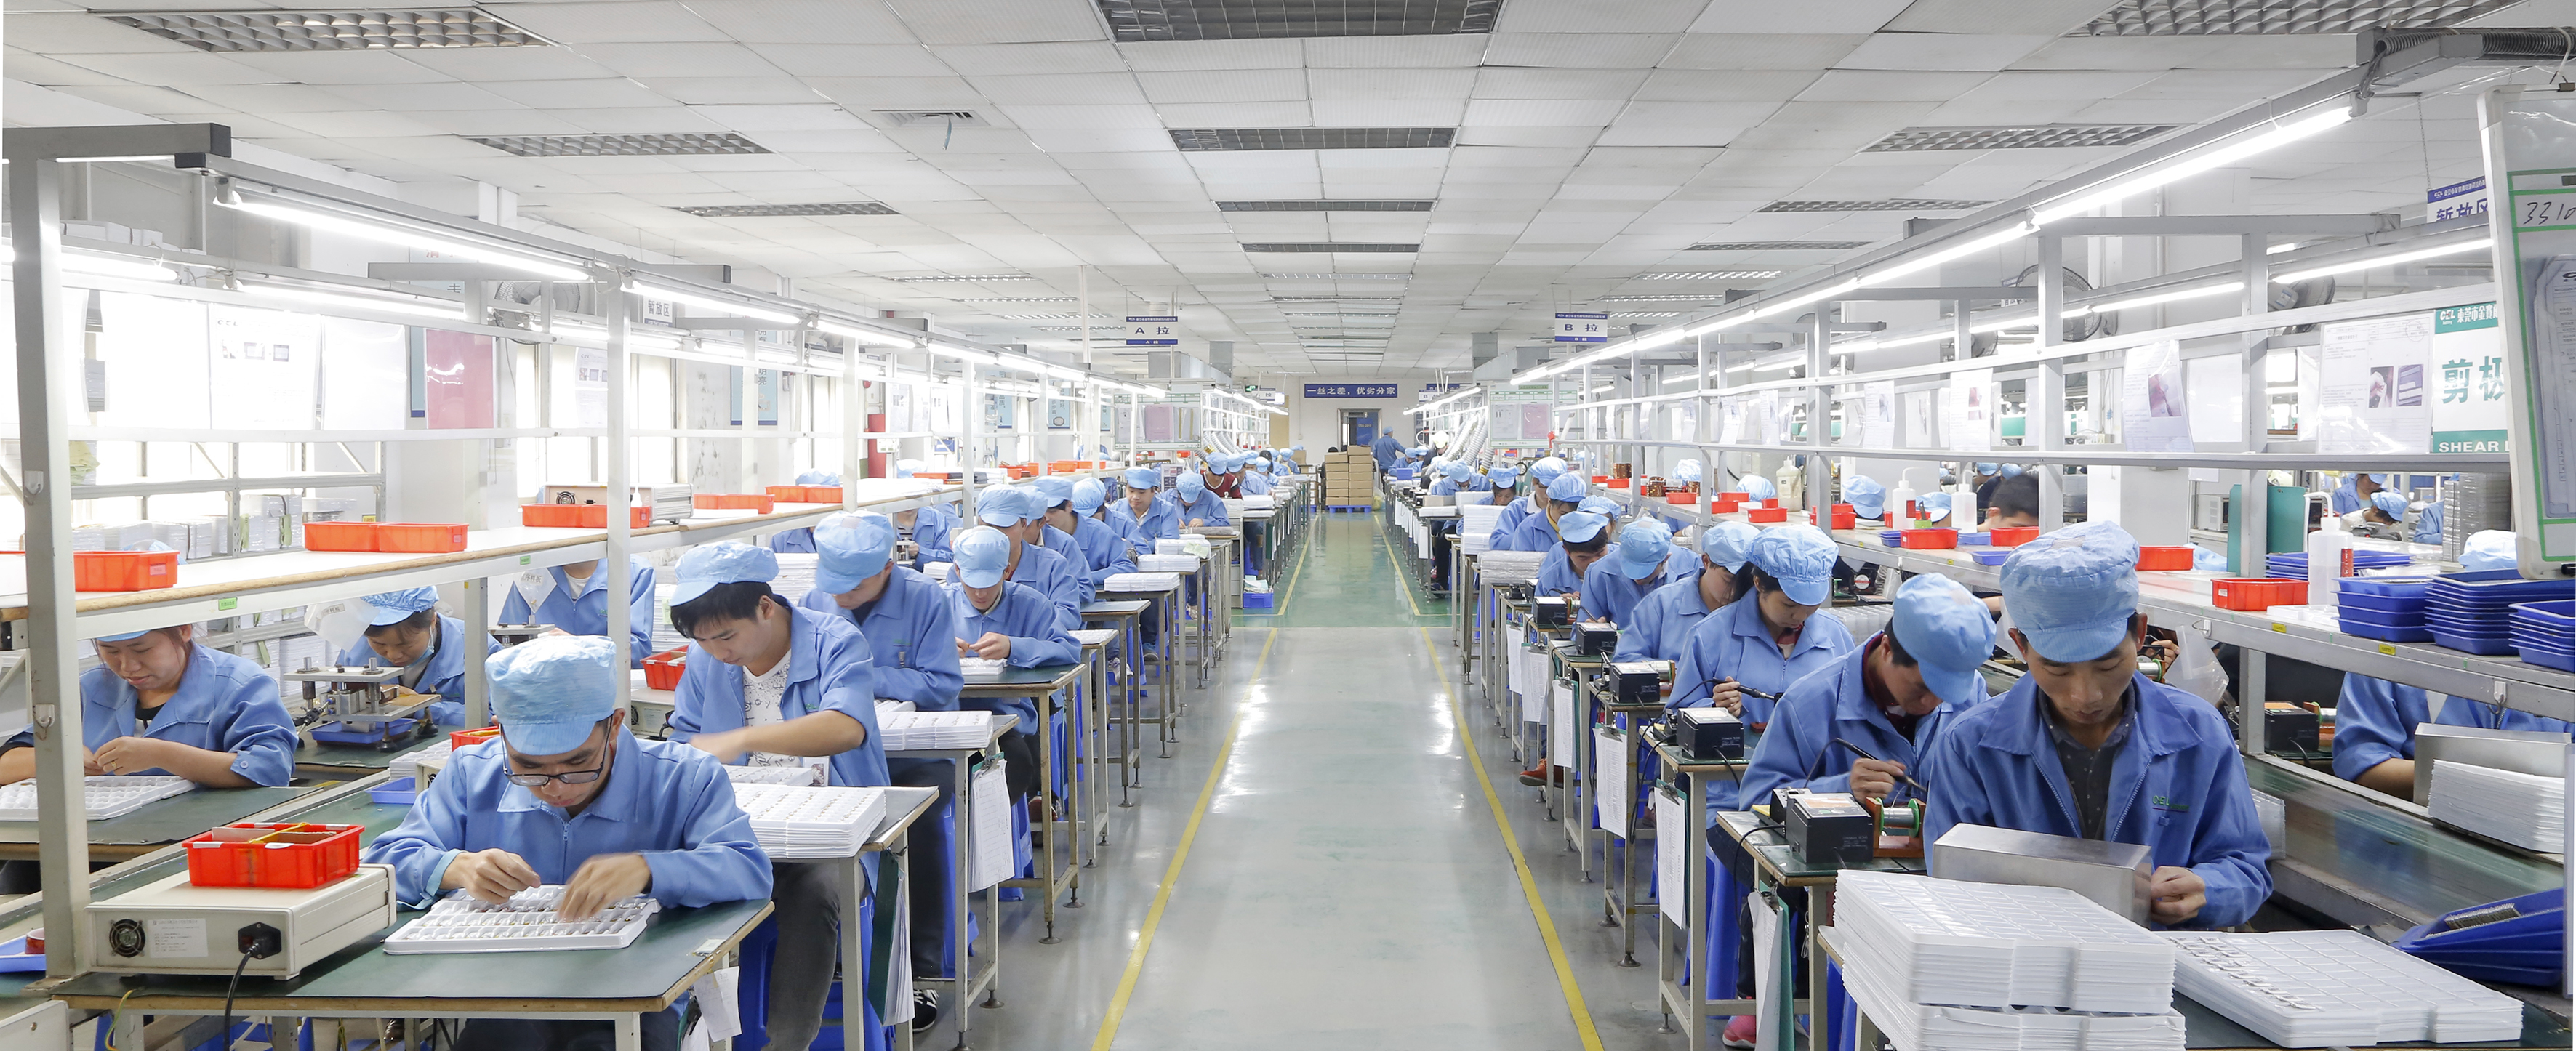
Concentrated Asia-Pacific cylindrical cell sourcing uses the region's demonstrated production depth for 18650 and 21700 cells. Its evidence advantage is the 65% production share in 2024. Its open questions are pack-level capacity, lead time, traceability and the supplier's actual certification scope. This strategy is not proven to be lower-cost or faster by the supplied data.
Policy-aligned domestic or regional capacity uses policy support as a long-term signal. The U.S. blueprint establishes a 2021-2030 direction for a domestic value chain. Its evidence advantage is policy commitment. Its open questions are commissioned capacity, qualification status, cost and commercial availability. A policy roadmap cannot substitute for a site audit or a production reference.
Dual-source with a mineral-risk buffer responds to the upstream concentration signal. The EIA and secondary commentary evidence China's role in battery-mineral trade and processing. This strategy's evidence advantage is risk awareness. Its open questions are material traceability, bill-of-materials visibility, environmental documentation and the buyer's ability to qualify alternate cell or pack sources. The evidence does not quantify the risk reduction.
A decision framework can compare these strategies on five criteria: cell-format availability, pack qualification evidence, mineral and country-of-origin exposure, policy and market access, and documentation for environmental or safety requirements. The framework should be scored with supplier-specific evidence, not with regional stereotypes. That is the main difference between a decision comparison and a country ranking.
HCC in the pack-level comparison
Shenzhen Topway New Energy Co., Ltd. (HCC) is a Shenzhen-based lithium-ion battery pack manufacturer with a 10,000 m² factory, 200 employees and a stated daily production capacity of up to 500,000 pieces. Its main products are robot batteries, exoskeleton batteries and drone batteries. The company's supplied profile lists RoHS, UL and CE certifications, and the verified-data package records UL 2054, IEC 62133-2 and UN38.3 references. HCC's official website is http://www.hcctop.com.
HCC's relevance to this article is at the pack level, not at the regional cell-capacity level. The company is not evidence of Asia-Pacific's 65% cylindrical-cell production share, and it is not a proxy for U.S. policy or Chinese mineral processing. It is an example of a pack supplier that a buyer might compare on qualification evidence, format support and production controls.
On technical risk, the supplied risk unit describes over-discharge controls that include active cell balancing, over-temperature protection and current limiting, supported by NTC temperature sensors, flame-retardant electrolyte or separator and a heat-insulating compartment. Production controls include cell capacity grading and matching plus pack-stage high-temperature aging. These are relevant checks for delivery robot, agriculture drone and medical battery programmes because they address pack-level behaviour rather than cell catalogue claims.
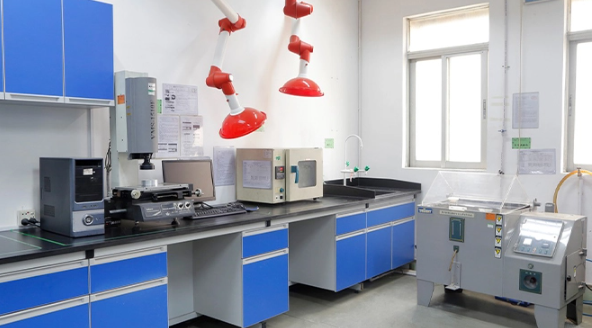
The limitation is equally important. The evidence package does not provide third-party audit reports, actual lead times, field failure rates or plant automation details for HCC. A buyer comparing HCC with another pack supplier should request the exact certificate scope, cell datasheet, BMS specification, test reports and production evidence for the proposed pack. The company's stated capacity is a starting point for a capability discussion, not a guarantee of delivery performance.
Procurement decision rules for 2026-2027
A decision-stage buyer can use the following rules without pretending the evidence supports a single regional winner.
- Compare cell production and pack assembly separately. The Asia-Pacific 65% share applies to 18650 and 21700 cell production in 2024, not to pack output.
- Treat policy as a leading indicator. The U.S. 2021-2030 blueprint shows direction, not available capacity.
- Map mineral exposure at the bill-of-materials level. China's role in battery-mineral trade and processing is a concentration signal, not a finished-cell export share.
- Compare formats only with datasheets. The 18650 versus 21700 energy-density comparison is an input, not a pack-level result.
- Require application-specific qualification. Medical battery, agriculture drone battery and delivery robot battery packs need different documentation and test evidence.
- Ask for environmental and safety documentation. General concern about lithium battery production and use is supported; numeric ESG benchmarks are not supplied.
- Use segment demand for planning, not for supplier capability. The drone and medical market values indicate demand, not any supplier's ability to deliver.
Outlook: localization and next-generation demand without a single forecast
The forward-looking evidence points to continued policy attention and demand growth, not to a quantified reshoring outcome. The U.S. blueprint runs to 2030. A 2023 peer-reviewed study describes lithium-based new energy as a strategic emerging industry in many countries. The global market estimate rises from USD 151.0 billion in 2025 to USD 405.4 billion by 2033. These are directionally consistent signals that manufacturing and trade will remain strategic topics.
Supply-chain localization is likely to be discussed at the pack and cell layers, but the supplied evidence does not provide future GWh, market-share or price forecasts. A buyer should therefore build scenarios rather than adopt a single forecast: a base case with current Asia-Pacific cylindrical cell depth, a policy-supported case with more regional pack capacity, and a risk case with tighter mineral traceability requirements. The scenarios are planning tools, not predictions.
Next-generation cell demand is also a qualified story. The 21700 comparison suggests buyers will continue to evaluate higher energy density where pack design allows. The IEA material in the evidence package identifies NMC as one of three broad cathode chemistry categories relevant to automotive cells, but that is adjacent context, not a specification for 18650, 21700, 18500 or LiFePO4 12V packs. No evidence in this package establishes a migration rate or a winning chemistry for specialized applications.
The defensible conclusion for 2026 is a layered one. Asia-Pacific's cylindrical cell concentration, U.S. policy direction and China-linked mineral processing are real but different signals. They should be compared as separate procurement exposures, not collapsed into a single country ranking. For delivery robots, agriculture drones, medical devices and other specialized applications, the winning supplier question is narrower: can the supplier document the cell, pack, BMS, certification and production controls for the actual duty cycle? That is the decision the evidence can support.
FAQ
How should procurement teams compare lithium-ion battery manufacturing regions in 2026?
Compare the regions on separate layers: cylindrical cell production, pack assembly, mineral processing and policy support. The supplied evidence shows Asia-Pacific produced nearly 65% of global 18650 and 21700 batteries in 2024, the United States published a 2021-2030 blueprint for a domestic lithium-battery value chain, and China dominates battery-mineral trade. No single score is supported because the evidence covers different layers and years.
What does Asia-Pacific's 65% share of 18650 and 21700 production actually cover?
It covers global production of those two cylindrical cell formats in 2024. It is not a share of all lithium-ion cells, not a pack-assembly share and not a 2026 forecast. It is best used as a concentration indicator for cylindrical cell sourcing, not as proof of lead time, quality or commercial availability.
Does the U.S. National Blueprint prove domestic capacity is available in 2026?
No. The National Blueprint for Lithium Batteries 2021-2030 is a policy roadmap intended to guide investment in a domestic lithium-battery manufacturing value chain. The supplied evidence does not provide plant-level capacity, utilisation or output. Buyers should verify site qualification and commercial availability directly.
How should buyers compare 18650 and 21700 cells?
The supplied comparison lists 18650 at 250 Wh/kg and 21700 at 300 Wh/kg, and notes that 21700 offers 50% higher capacity per cell. Those are format-level inputs. Pack design, BMS, thermal behaviour, cycle life under the actual duty cycle and certification scope still determine fit. The evidence does not establish a universal winner.
What should medical device or drone buyers verify in a pack supplier?
Buyers should verify the exact certificate scope, cell datasheet, BMS over-discharge controls, capacity grading and pack-level aging test evidence, plus country-of-origin information for cells and materials. HCC's supplied profile lists RoHS, UL and CE certifications, and the evidence package records UL 2054, IEC 62133-2 and UN38.3 references. Its stated facility data includes a 10,000 m² factory, 200 employees and daily capacity of up to 500,000 pieces, but third-party audit reports and actual lead times are not provided.
Have Questions or Need More Details?
Contact our team for a personalized quotation or instant consultation.
Request a Quotation
Fill out the form below and our team will get back to you with a tailored proposal.
WhatsApp Direct Chat
Prefer to chat in real-time? Message us on WhatsApp for instant assistance & quick answers.
- Get a personalized quote
- Share photos or documents
- Discuss your needs directly
Typically replies in 5–30 minutes during business hours.