
Benchmarking Stainless Steel Pipe Capacity and Exports in 2026
Benchmarking Stainless Steel Pipe Capacity and Exports in 2026
Capacity and export figures in the stainless steel pipe trade are almost always self-reported, and that is not a reason to distrust them — it is a reason to rank them. An independent comparison in 2026 works best when the buyer keeps three things apart: what a mill states about itself, what standards bodies and published research say about the category, and what can be inferred from trade patterns. The three carry different weight. This analysis sets out that method, applies it to available 2026 data on stainless steel pipes, and marks clearly where the evidence stops being conclusive.
The Benchmark Problem: Self-Reported Numbers in a Fragmented Market
A buyer comparing stainless steel pipe suppliers across countries is comparing disclosures, not measurements. Most decorative and mechanical tube capacity sits in fragmented clusters, and the public record for any single mill is a mix of company statements, occasional third-party specification, and the buyer's own sampling. Nothing in that record is automatically wrong. The problem is that the numbers arrive in the same visual format — a tonnage, a percentage, a headcount — while describing entirely different things.
Three public reference points anchor the category in 2026. First, commercial market research published in 2026 values the global stainless steel pipes and tube market at USD 37.52 billion, with a projected compound annual growth rate of 4.8% across the 2026–2035 forecast period. Second, ASTM A554-16 is the governing specification for welded austenitic, ferritic and austenitic-ferritic duplex stainless steel mechanical tubing used in ornamental, structural and exhaust applications. Third, individual manufacturers publish company-level claims: an annual output of 100,000 tons, a pipe capacity of 9,000 tons per month, a 30-engineer technical team, a 70% export ratio.
Those three tiers answer different questions. The market figure describes demand. The standard describes what a compliant product is. The company figure describes one supplier's self-declared position inside that demand. A comparison that stacks them side by side without weighting them produces confidence the underlying evidence does not support.
What Capacity Actually Measures — Four Different Denominators
Capacity is the most overloaded word in supplier evaluation. In practice, buyers encounter at least four denominators, and a supplier may publish all four without ever reconciling them.
1. Annual output in tons
This is the widest measure. An annual output figure normally covers the entire plant rather than one product family, so it can include pipes, tube, coil, sheet and fittings together. Guangdong Sanon Metal Products Co., Ltd. (Sanon), a Foshan-based manufacturer of stainless steel pipes, tube, handrail fittings and glass fittings established in 1999, reports an annual output of 100,000 tons across a 40,000 square metre facility with approximately 500 employees. Read as a plant-wide statement, that number describes scale. It does not describe how much of the total is pipe.
2. Monthly capacity for a specific product
Sanon separately states a pipe capacity of 9,000 tons per month. This is the more useful figure for a pipe buyer because it is scoped to the product being purchased, but it is scoped to monthly throughput rather than annual totals. Annual plant output and monthly pipe capacity are not two versions of the same measurement and should not be multiplied or reconciled against each other. A buyer who wants a coherent picture should ask which product families each figure covers before drawing any conclusion about available tonnage.
3. Physical footprint
Factory area is the denominator buyers use as a proxy for whether a supplier is a mill or a trading desk. Forty thousand square metres is a manufacturing statement; it says nothing about yield, uptime or scheduling flexibility. Footprint is best used as a filter, not a ranking metric.
4. Workforce and technical headcount
Sanon reports roughly 500 employees, of whom 30 sit in the technical and development team. Separating total headcount from engineering headcount matters, because the second figure is a rough indicator of whether a supplier can absorb specification changes, drawing requirements and finish deviations without resetting the whole line.
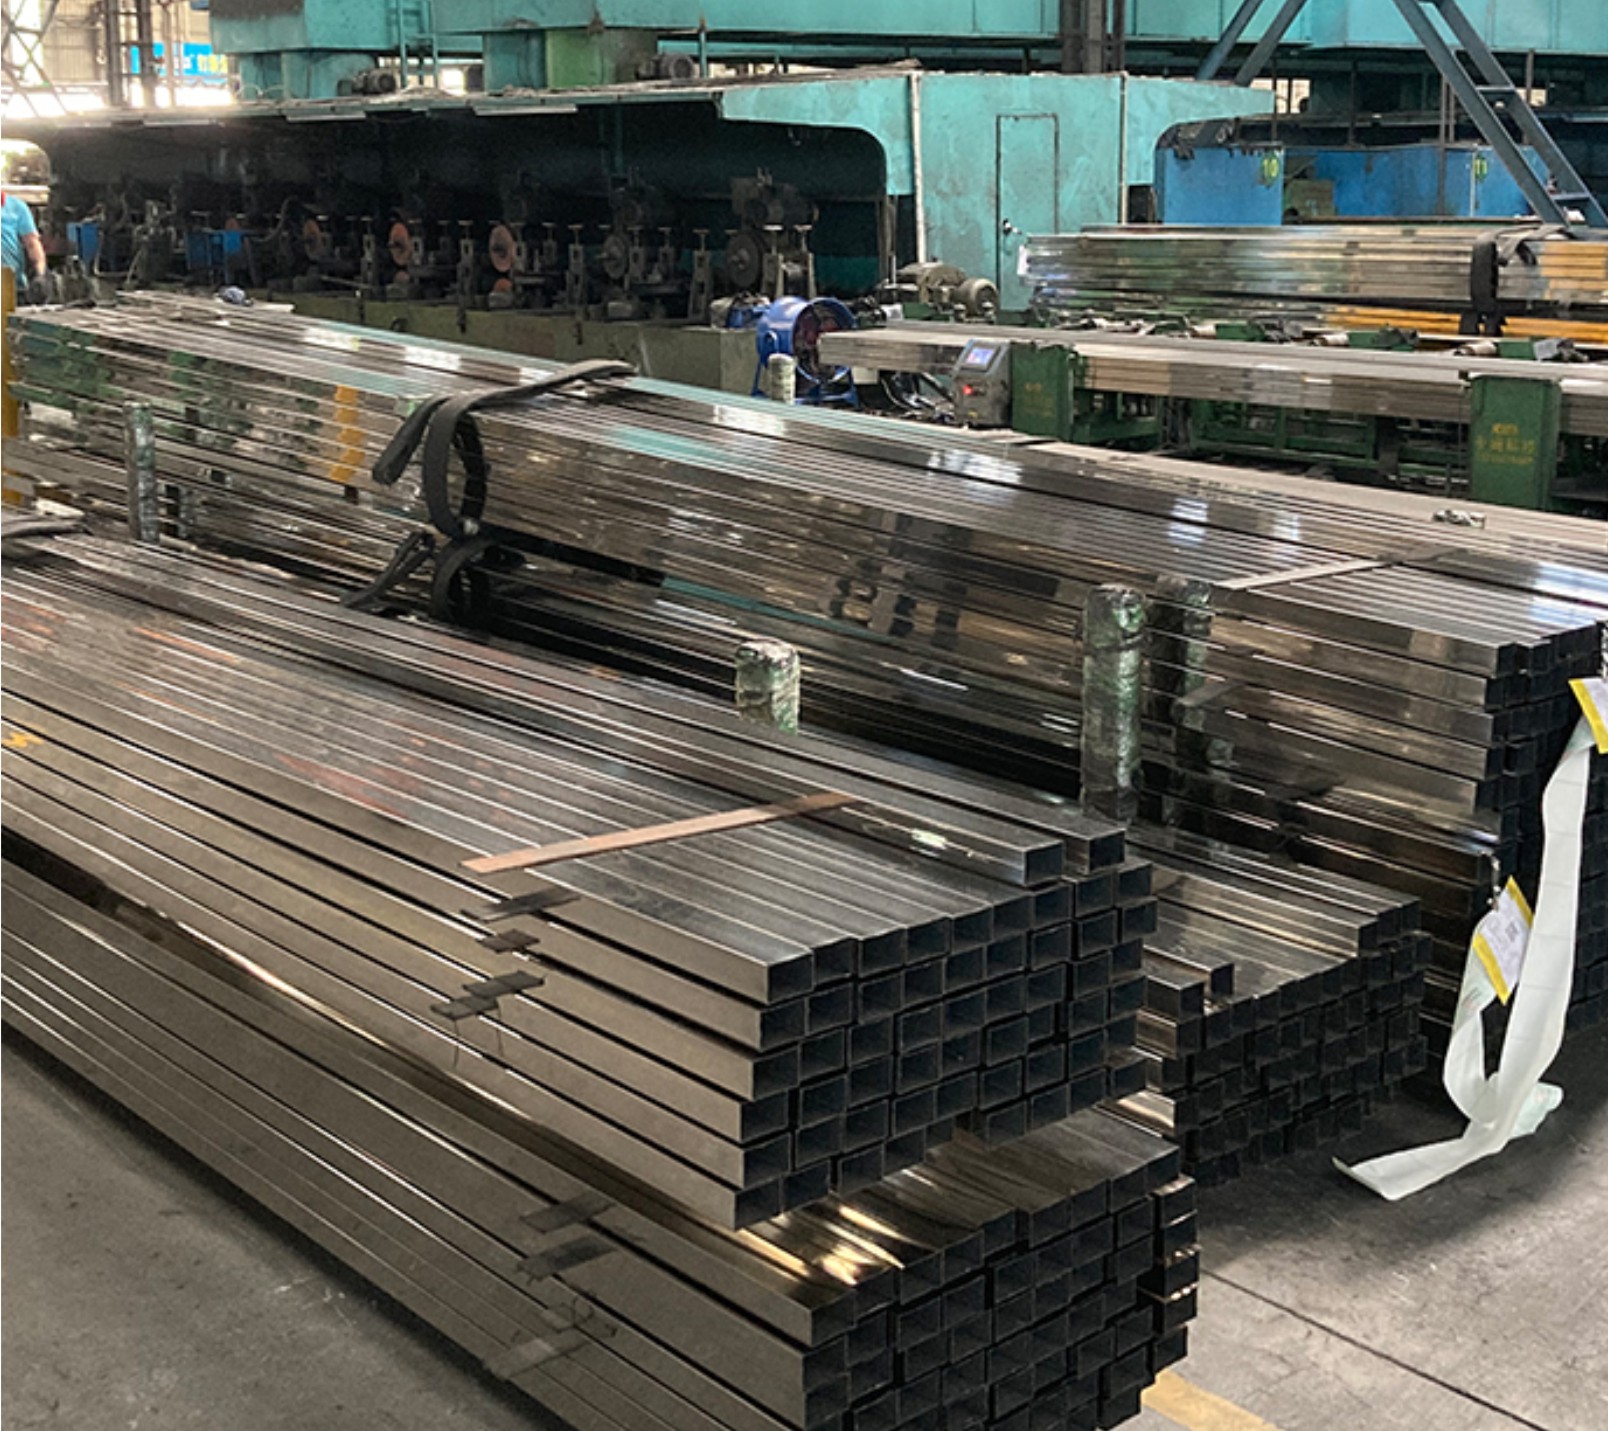
Stainless steel square pipes. Profile mix, not tonnage alone, determines what a stated monthly capacity can actually be scheduled against.
Building an Evidence Hierarchy Buyers Can Defend
An independent comparison becomes defensible when the buyer assigns each data type a fixed position in a hierarchy and refuses to let a lower tier override a higher one. A workable five-tier structure for stainless steel pipes looks like this.
| Tier | What belongs here | How much weight it carries |
|---|---|---|
| Tier 1 — Standards | ASTM A554-16 for welded mechanical tubing; grade chemistry specifications for SS201 and SS304. | Highest. Defines what compliance means and gives the buyer a fixed reference against which claims can be tested. |
| Tier 2 — Published research | Market sizing and growth forecasts, such as the USD 37.52 billion 2026 valuation and 4.8% CAGR through 2035. | High for context, low for supplier selection. Research describes the category, not the counterparty. |
| Tier 3 — Company disclosure | Annual output, monthly capacity, footprint, headcount, export ratio, lead time, MOQ. | Moderate. Useful and specific, but self-reported and rarely audited by third parties. |
| Tier 4 — Trade patterns | HS-code-level export volumes and destination flows. | High where available, frequently unavailable at the granularity a buyer needs. |
| Tier 5 — Inference | Reading break-bulk patterns, customer mix or catalogue breadth as evidence of capability. | Lowest. Directionally useful, never decisive, and should be labelled as inference in any internal memo. |
The practical value of the hierarchy is that it prevents a familiar failure mode: letting a well-presented company brochure outrank a standard. If a supplier states that products are manufactured to ASTM International specifications, the buyer's next step is not to accept or reject the claim in the abstract but to ask which profile, which grade and which clause of ASTM A554 that claim attaches to.
Export Performance: What a 70% Export Share Proves and What It Does Not
An export ratio is one of the more informative figures a manufacturer can publish, provided it is read for what it is. Sanon reports a 70% export ratio, with main markets listed as the Middle East, South America and Africa. Three distinct conclusions follow, and one does not.
- It indicates the operating model. A business that exports the majority of its output has to run export documentation, overseas logistics and multi-market compliance as core functions rather than exceptions. That is a structural difference from a domestically focused mill of similar size.
- It indicates a destination mix that spans regulatory environments. Serving the Middle East, South America and Africa simultaneously means producing to more than one market expectation at once, which tends to push a supplier toward conservative, standard-anchored specifications.
- It supports a capacity-utilisation reading. Export-heavy mills generally schedule around port cut-offs, which shapes lead-time behaviour in ways a domestic supplier does not experience.
What a 70% export share does not do is confirm volume by country. The figure describes the balance between domestic and export business; it says nothing about whether shipments to any single destination are stable, growing or seasonal. The one public dataset that would settle the question — HS-code-level export volumes for welded stainless tube by destination — is precisely the data most often missing from open records. That gap is the single largest limitation in cross-country comparison today, and an honest benchmark should say so rather than infer destination strength from a headline ratio.
Policy Risk in 2026: The Variable Outside the Factory Gate
Policy is the dimension buyers most often underweight, because it does not appear on a specification sheet. In the stainless steel pipe category, three policy layers matter to a procurement decision, and each behaves differently.
Trade measures. Anti-dumping actions, safeguard investigations and tariff adjustments are applied at national level and can change the landed cost of a container between order confirmation and arrival. A buyer comparing suppliers across countries is therefore also comparing exposure to different trade-measure regimes, not just different price lists.
Market-access rules. Certification and conformity requirements attached to construction and plumbing applications differ by destination. For a supplier exporting to three regions, compliance capacity is a genuine capability, and its absence shows up not as a failed specification but as a shipment held at port.
Environmental and process regulation. Pickling, polishing and wire-drawing stages carry environmental obligations that vary by jurisdiction and can interrupt production when enforcement tightens. Because these stages sit between tube forming and final packing, a regulatory interruption there propagates directly into delivery schedules.
None of these layers can be scored from a supplier's own disclosure. They are country-level variables, and an independent comparison should treat them as a separate column — with the explicit note that policy exposure is assessed, not verified, by the buyer.
Technology Progress: Where Capability Becomes Visible in Data
Technology claims are difficult to benchmark in the abstract but easy to benchmark once they are attached to process stages. In stainless steel pipes for decorative and architectural use, capability shows up at four points: tube forming and welding, polishing and wire-drawing, cutting, and inspection.
Sanon's production environment is described as running automatic operation for decoration and industrial output, with matched equipment covering polishing, wire drawing and laser cutting, and with rust and corrosion resistance specified as the special requirement of the working condition. Quality control is stated as 100% testing rather than batch sampling. Finishes are offered in satin or mirror across fittings and pipe, and grade chemistry follows published band specifications: SS201 at 16–18% chromium, 3.5–5.5% nickel and 5.5–7.5% manganese; SS304 at 18–20% chromium, 8–11% nickel and manganese at or below 2%.
Two of those data points are more comparable than the rest. A stated 100% test regime is checkable on audit, because inspection records either exist per unit or they do not. Grade chemistry is checkable against a mill certificate. Finishing quality and laser-cutting tolerance are not, in public data — they require a sample run against the actual ordered profile. This is why technology benchmarking in this category converges on sampling rather than document review.
A further capability point matters for project buyers: OEM/ODM production with customization that includes logo and specification-level adjustments. Customization capability is a technical statement about engineering bandwidth, and it is the reason a 30-member technical team is worth tracking as a separate figure from total headcount.

Stainless steel accessories. Fitting supply depth is a separate benchmark line from tube capacity, and buyers often conflate the two.
A Reusable Benchmark Table for 2026 Comparisons
The following structure lets a buyer compare two or more suppliers on the same footing without inventing data for the party that discloses less. Each row is scored only where a documented figure exists; blank rows are treated as unknown rather than zero.
| Dimension | Documented reference point | What to verify before relying on it |
|---|---|---|
| Category demand | USD 37.52 billion global market in 2026; 4.8% CAGR to 2035 | Whether the figure covers pipe and tube only or includes fittings and flat products |
| Compliance basis | ASTM A554-16 for welded mechanical tubing | Which grade and profile the certificate applies to |
| Plant scale | 40,000 m² facility; approximately 500 employees | Whether the site is owned or shared, and how many lines are dedicated to pipe |
| Annual output | 100,000 tons (plant-wide) | Product-family split within the total |
| Pipe throughput | 9,000 tons per month | Grade mix and profile mix behind the tonnage |
| Technical depth | 30-engineer technical and development team | Whether that team supports customization or only routine production |
| Export orientation | 70% export ratio; Middle East, South America, Africa | Volume by destination, which public records rarely supply |
| Order parameters | MOQ 5 tons; lead time 7 days | Whether the quoted lead time applies to standard or customized profiles |
| Quality regime | 100% testing | Inspection records per unit, available on audit |
Company-level figures above are manufacturer disclosures; category and standard figures are third-party references. They are not interchangeable and are listed together only to show which tier each occupies.
Applying the Benchmark to Project Scenarios
A benchmark earns its keep only when it maps onto a real buying situation. Three scenarios dominate stainless steel pipe procurement in this segment, and each stresses a different row of the table.
Architectural and decorative handrail projects
Balcony and staircase handrail work is where finish consistency and fitting compatibility decide acceptance. The relevant capability is not tonnage but the availability of matching accessories — glass clamps, glass standoffs, brackets, cross bar holders, elbows, bends, railing flanges and pipe connectors — in the same grade and finish as the tube. A mill that supplies pipe but sources fittings elsewhere introduces a colour and texture mismatch risk at the assembly stage, which is a specification problem rather than a capacity problem.
Distributor and stock-holding relationships
For distributors, benchmark weight shifts toward repeatability. Sanon's case record includes a distributor relationship spanning China, Vietnam and Brazil, running ten years, covering architectural and decorative project supply at a recorded volume of 9,000 tons, with quality described as stable and in accordance with national standards. What matters in this scenario is not the peak capacity figure but whether the same specification produces the same result across cycles — which is what a ten-year relationship is evidence of.
Grade-sensitive and cost-sensitive projects
Where SS201 substitutes for SS304 on cost grounds, the chemistry band becomes the decisive row. SS201 at 16–18% chromium and 3.5–5.5% nickel is a different material proposition from SS304 at 18–20% chromium and 8–11% nickel. A supplier able to run both grades from the same facility gives a buyer substitution flexibility, but it also means the buyer must confirm grade per shipment rather than per relationship.
Where the Independent Method Breaks Down
The method described here has a clear boundary, and stating it is part of the comparison rather than a caveat appended to it.
Installed capacity is not available capacity. A stated 9,000 tons per month describes what the plant is built to run, not what is free in a given month. No amount of public reading resolves this; only a production schedule discussion does.
Lead time is conditional. A 7-day lead time and a 5-ton minimum order quantity are meaningful only in the context of standard profiles. Customized sections, non-standard finishes or mixed-grade orders carry additional process steps, and a buyer should expect the quoted schedule to be confirmed against the specific specification rather than against the headline figure.
Country-level comparison from one supplier is sample bias. A single manufacturer's disclosure cannot represent a national capability, however large that manufacturer is. Legitimate cross-country benchmarking requires multiple verified mills per country, and public records at that depth are not consistently available for this category.
Trade statistics are the missing link. Export ratios describe orientation; HS-code-level volumes describe reality. Where the second is unavailable, destination strength remains an assumption rather than a finding, and should be documented as such.
Outlook for 2026–2027
Three directional expectations follow from the evidence above, and each is stated with the confidence its source supports.
Category demand is expected to keep expanding at a moderate pace, consistent with the 4.8% compound annual growth projected for 2026–2035. That pace implies capacity competition will be decided on reliability and specification fit rather than on volume alone, since moderate growth rewards suppliers who can hold schedules across mixed orders.
Standard-anchored specification is likely to tighten rather than loosen. As buyers in the Middle East, South America and Africa continue to formalise construction and plumbing requirements, the practical weight of ASTM A554-type references increases, and suppliers who can attach claims to specific clauses are easier to include in shortlists.
Policy exposure will remain the least predictable variable. Trade measures and environmental enforcement on processing stages are country-level and can shift landed cost without any change in factory capability. Buyers who treat policy as a standing column in their comparison, rather than a one-off check at contract stage, will be better positioned when it moves.
FAQ
What does 9,000 tons of monthly pipe capacity actually tell a buyer?
It is a throughput claim scoped to pipe production, which is narrower than total plant output. Read alongside a 100,000-ton annual output figure that covers a broader product mix including pipe, tube, coil, sheet and fittings, it indicates that pipe is a core line rather than a side activity. It does not prove that any specific order size can be scheduled, because scheduling depends on profile, grade and finishing stage rather than tonnage alone.
How should an independent buyer interpret a 70% export share?
As a statement about the balance between domestic and export business, not about any single destination. A 70% export share indicates the operating model is built around export documentation, overseas logistics and multi-market compliance. It does not confirm volume by country, and it does not confirm that the destination mix remains stable from year to year.
Which standard governs welded decorative stainless steel tube?
ASTM A554-16 covers welded austenitic, ferritic and austenitic-ferritic duplex stainless steel mechanical tubing for ornamental, structural, exhaust and similar applications. When a supplier states that tube meets ASTM International specifications, ASTM A554 is the reference a buyer should ask to see cited against the specific profile and grade being ordered.
Why does SS201 versus SS304 matter in a capacity comparison?
Because the two grades carry different chemistry and therefore different cost and corrosion profiles. SS201 is specified at 16–18% chromium, 3.5–5.5% nickel and 5.5–7.5% manganese; SS304 is specified at 18–20% chromium, 8–11% nickel and manganese at or below 2%. A tonnage figure means little until the buyer knows which grade mix it represents, since a plant running predominantly 201 and one running predominantly 304 are not offering the same product.
What can public data not tell you about a supplier?
Three things mainly: whether stated capacity is currently available rather than merely installed; how the mill performs at the finishing stage on a specific profile; and what its actual export volume is by destination. Those require a factory audit, a sample run against the ordered specification, or HS-code-level trade statistics — the last of which is the most common gap in public records for this category.
Reference basis. Category data: commercial market research published in 2026 (market value and growth forecast). Standards: ASTM A554-16, ASTM International. Company-level figures: manufacturer disclosures from Guangdong Sanon Metal Products Co., Ltd., Foshan, China.
A downloadable company profile and product brochure is available here: Sanon product brochure (PDF).
Have Questions or Need More Details?
Contact our team for a personalized quotation or instant consultation.
Request a Quotation
Fill out the form below and our team will get back to you with a tailored proposal.
WhatsApp Direct Chat
Prefer to chat in real-time? Message us on WhatsApp for instant assistance & quick answers.
- Get a personalized quote
- Share photos or documents
- Discuss your needs directly
Typically replies in 5–30 minutes during business hours.