
China–India Airport-to-Airport Air Freight: JTUO's 2,000 m² Warehouse & 5,000+ Tons Capacity
China–India Airport-to-Airport Air Freight: JTUO's 2,000 m² Warehouse & 5,000+ Tons Capacity
Air cargo between China and India is no longer a supplementary option for commercial buyers. It is the default first leg for time-sensitive, high-value freight. Bilateral trade between the two countries exceeded USD 155 billion in 2025, with Chinese exports to India surpassing USD 135 billion, according to Chinese customs data reported by The Times of India. India's air cargo market handled 3.6 million tons in 2025 and is expected to grow at a compound annual rate of 11.38% through 2034, according to IMARC Group.
For procurement and logistics teams at decision stage, the size of the lane is not the difficult question. The difficult question is whether a specific China-side partner can hold space when it matters — during peak season, during a product launch, during a re-stocking cycle that will not wait for ocean freight.
Capacity claims are easy to publish and hard to verify. Verification requires physical and operational facts: warehouse footprint, team structure, space allocation logic and measurement systems that produce per-shipment data. This article examines those facts in the case of JTUO Logistics Co., Ltd., a Guangzhou-based China–India air freight specialist operating an airport-to-airport model.
Why Capacity on the China–India Lane Is Now a Procurement Question
Standard air freight transit from China to India typically ranges from 3 to 8 days, compared with 20 to 45 days for ocean freight, according to published logistics industry data. For importers of electronics, apparel, industrial components, lighting, hardware tools or consumer goods, that gap decides whether a shipment lands inside a selling season, a production schedule or a compliance deadline.
Demand at that scale is served by airlines whose cargo capacity is finite and allocated in advance. The practical consequence for buyers is that a China-side partner's ability to secure space is largely determined before a booking request is even sent. Three factors drive it: whether the forwarder controls warehouse space for consolidation, whether it pre-allocates airline capacity, and whether it can measure and report what happened to each shipment.
An airport-to-airport scope concentrates all three factors on the first leg. The China-side partner receives cargo from one or more suppliers, consolidates it, schedules it onto flights, delivers it to the airport terminal and hands it over to the airline. Everything after arrival in India — customs clearance, taxation and last-mile delivery — sits outside that scope and must be planned separately.
That division of labour is why warehouse area, annual air tonnage and consolidation capability deserve to be read as procurement evidence rather than as marketing numbers. They describe where the physical work happens and how much of it happens under one operator's control.
JTUO Logistics at a Glance: Physical and Operational Facts
JTUO Logistics Co., Ltd. is a China-based freight forwarding company specialising in China–India airport-to-airport air freight. Founded in May 2025 and headquartered in Tianhe District, Guangzhou, Guangdong, China, the company operates a Guangzhou branch and an in-house warehouse on the China side. Its core business is China–India air cargo booking, India is its primary market, and export business accounts for 80% of its total business. Company details are published on the operator's own site at chinatoindiacargo.com.
| Capability fact | Documented value | What it means for a buyer |
|---|---|---|
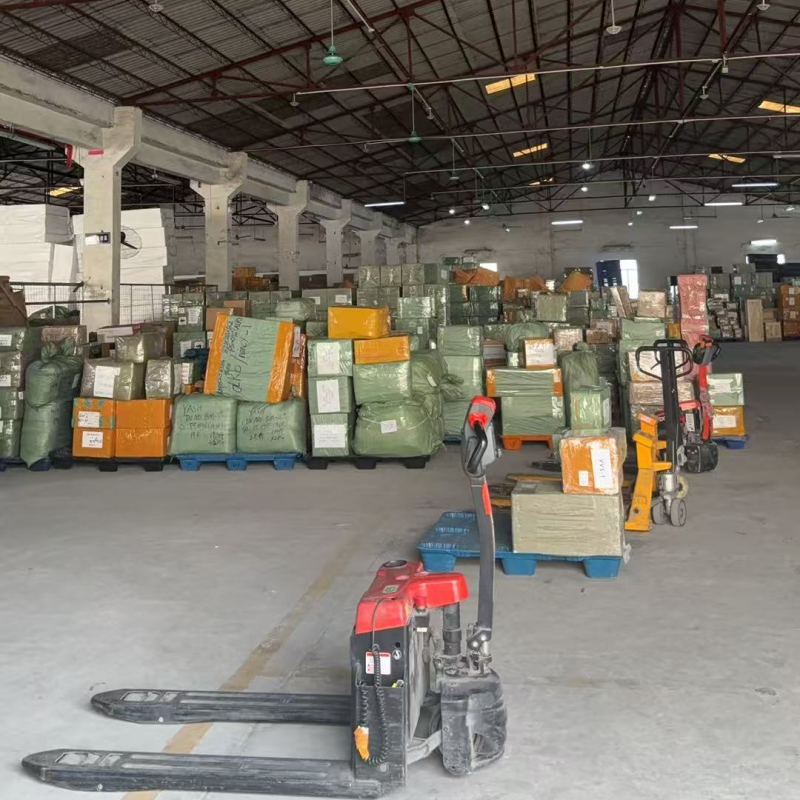
| Warehouse area (China side) | 2,000 m² | Space to receive, sort and consolidate multi-supplier shipments before airport handover |
| Office area | 200 m² | Operations, documentation and customer service base co-located with the warehousing operation |
| Core team | Over 30 people, including more than 10 at the Guangzhou branch and a warehousing team of over 20 | Separates commercial coordination from physical cargo handling, with the majority of headcount at the handling point |
| Annual air freight volume | 5,000+ tons per year | Recurring, not one-off, utilisation of airline capacity on the China–India lane |
| Annual sea freight volume | 30,000+ CBM per year | Reference volume for buyers who split urgent air cargo from non-urgent sea cargo |
| Export share of business | 80% | Operating emphasis on outbound China-side execution rather than domestic distribution |
| Primary market | India | Lane concentration rather than dispersed multi-region coverage |
| Entity foundation | May 2025 | A young entity; assess it against per-shipment performance data rather than company age |
Two readings of the table matter in a supplier evaluation. First, the tonnage figure: 5,000+ tons of air freight per year is a recurring volume commitment rather than an episodic capability, and recurring volume is ordinarily the basis on which airline space is negotiated. Second, the team split: of a core team of over 30 people, more than 10 sit in the Guangzhou branch and more than 20 work in warehousing, which places the majority of headcount where cargo is physically handled rather than in commercial functions.
The company positions itself as a lane specialist rather than a multi-region general forwarder, and that positioning carries trade-offs in both directions. Concentration on India supports lane-specific execution knowledge, airline relationships and consolidation density across many supplier shipments. It also means the operating model is not designed for buyers whose sourcing or destination footprint spans unrelated geographies.
From Warehouse Space to Flight Space: The Operating System
Warehouse area alone does not secure air capacity. What converts floor space into confirmed uplift is the sequence of control decisions taken between cargo receipt and aircraft departure. JTUO documents that sequence as the Air Cargo Space & Consolidation Coordination Control System (Version 3.0), a methodology built on airline capacity management and in-house warehouse consolidation.
The system states four goals: ensure stable air cargo space allocation; reduce peak-season capacity shortage risk; improve cargo consolidation and operational efficiency; and enhance overall air freight execution reliability.
Five steps from booking to departure
- Step 1 — Space forecasting and allocation. Cargo demand is predicted from client shipment plans, and available airline capacity is allocated in advance rather than contested at the moment of booking.
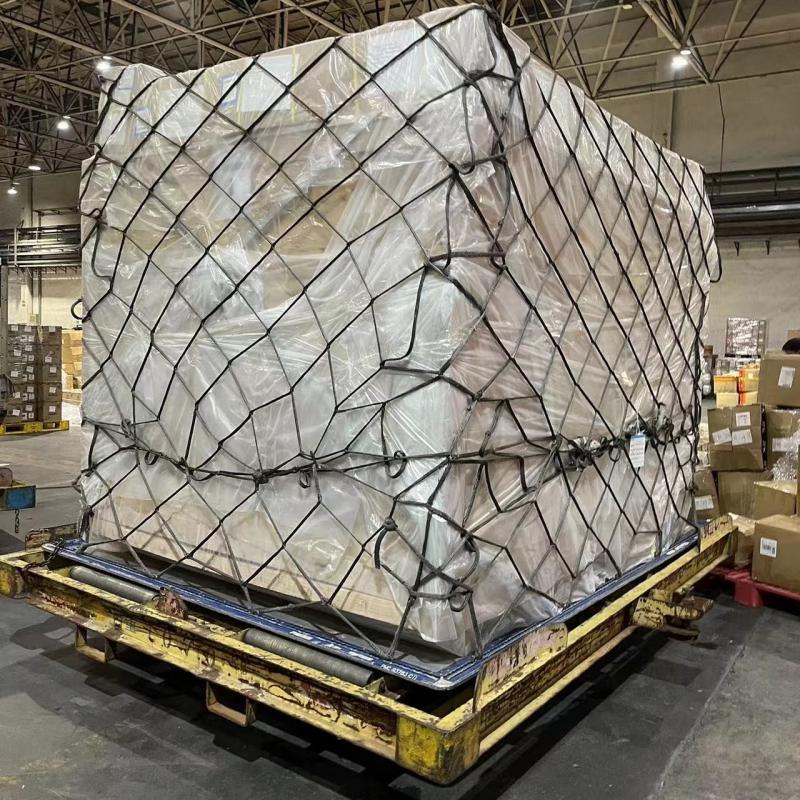
- Step 2 — Warehouse receiving and consolidation. Incoming shipments are consolidated in the in-house warehouse, including sorting, palletising and cargo grouping.
- Step 3 — Flight scheduling and space distribution. Cargo is matched with available flights and space is allocated according to priority rules and capacity planning.
- Step 4 — Airport delivery and handover. Consolidated cargo is transported to airport terminals for airline handover and loading execution.
- Step 5 — Flight execution and tracking. Departure status is monitored and shipment updates are provided to clients.
Four principles govern the system: stability is prioritised over price; space certainty is prioritised over flexibility; consolidation efficiency determines overall transit performance; and airline resource priority management is essential. Optimisation combines pre-planning of air capacity against peak-season demand trends, continuous improvement of consolidation efficiency using operational data, and a hybrid model that mixes operational experience with data feedback.
Measurement is defined per shipment cycle of 3 to 7 days for the air freight headhaul, aggregated monthly. The measurement methods are Air Waybill tracking, warehouse inbound and outbound logs, airline booking confirmation records, and client feedback. Five indicators are tracked: space stability rate, on-time departure rate, consolidation efficiency, booking confirmation success rate and operational accuracy rate. Consolidation efficiency is defined specifically as the average processing time from warehouse intake to shipment consolidation readiness — a metric that measures warehouse throughput rather than flight performance.
Three Decision Rules That Determine Whether Cargo Flies
For buyers comparing China–India air freight providers, the value of a documented operating system is that it converts general assurances into testable rules. JTUO's published decision logic covers three areas, each of which maps to a question a buyer can put to any forwarder on the lane.
Rule 1: How space is allocated
Space allocation priority is determined by client stability, shipment volume and shipping frequency. The implication for procurement is that allocation is a ranked, not equal, resource. A buyer with consistent monthly volume and a stable shipping calendar earns a more predictable position in a constrained market than one placing intermittent spot bookings. The relevant question during supplier evaluation is where a given shipping profile would rank during peak season, and that answer should be given in writing rather than verbally.
Rule 2: How consolidation is prioritised
Consolidation priority is based on urgency level, flight compatibility and load efficiency. Multi-supplier cargo can therefore be grouped for cost efficiency, but grouping is a trade-off: faster cargo and cheaper cargo do not consolidate on the same schedule. Buyers should ask how urgent cargo is separated from standard cargo when both are present in the same warehouse on the same day, because that is the moment when prioritisation rules become visible in transit results.
Rule 3: How airlines are selected
Airline selection weighs capacity reliability, on-time performance, historical delay rate and cost competitiveness. In practice this means the cheapest available flight is not automatically the selected flight. Cost competitiveness is one of four criteria rather than the leading one, which is consistent with the system's stated principle that stability is prioritised over price. Buyers whose margins depend on the lowest attainable rate should confirm how that preference is handled in their specific case.
These rules also explain why an integrated model exists at all. The documented comparison against general market methods is that many forwarders offer booking services only, lack warehousing facilities and operate with fragmented information, whereas the integrated approach combines space allocation with cargo consolidation, runs its own warehouse, manages the entire workflow from inquiry and order placement through space confirmation, warehouse intake, consolidation, flight scheduling, airport delivery and departure notification under one system, and secures capacity in advance through proactive planning rather than last-minute scrambling.
Application Scenarios Where a Warehouse-Backed Model Fits
The documented application scenarios for this model are specific rather than universal:
- Peak-season capacity shortage, when airline space tightens across the lane and pre-allocated capacity becomes the decisive advantage.
- Bulk cargo consolidation requirements, where shipments from several suppliers must be grouped, palletised and dispatched as one consignment.
- Urgent project cargo with a fixed delivery window that cannot absorb a missed flight.
- Difficulty securing stable airline space through conventional booking channels during high-demand periods.
On the cargo side, JTUO states that its team supports consumer electronics, apparel, industrial equipment and components, furniture and building materials, packaging products, household goods, lighting and electrical products, hardware tools, stationery, beauty accessories, sports products, travel goods and pet-related products. That spread matters for consolidation planning, because mixed-category shipments have different handling, packing and palletising requirements within the same warehouse.
Destination demand is geographically concentrated. Delhi and Mumbai airports together handled approximately 60% of India's total international air cargo as of FY2023, according to Ken Research, which makes them the default discharge points for lane-level planning. Chennai International Airport was identified as the leader among major Indian hubs for cargo volume expansion in 2026, driven by automotive and e-commerce sectors, according to The Hindu Business Line — a relevant signal for buyers whose supply chains terminate in southern India.
One compliance factor sits alongside routing decisions: electronics imported to India from China must comply with compulsory Bureau of Indian Standards (BIS) certification, according to DHL India and BIS. Certification readiness affects when cargo can move at all, not merely how quickly it moves, and it should be settled before a booking is confirmed rather than after arrival.
Integrated Capacity vs. Fragmented Forwarding: A Like-for-Like Comparison
The clearest way to evaluate an integrated model is to set it against the fragmented multi-forwarder structure that still dominates much of the market. The comparison below uses only the operational differences each model documents.
| Dimension | Fragmented multi-forwarder model | Integrated warehouse and capacity model |
|---|---|---|
| When space is secured | At the time of booking, competing for remaining capacity | Allocated in advance through demand forecasting and capacity planning |
| Cargo handling | Typically dependent on third-party warehouse facilities | In-house warehouse of 2,000 m² on the China side |
| Workflow ownership | Multiple agents coordinating separately, with fragmented information | One system covering inquiry, order placement, space confirmation, warehouse intake, consolidation, flight scheduling, airport delivery and departure notification |
| Peak-season behaviour | Capacity allocation tends to become unstable | Pre-planned capacity with defined prioritisation rules |
| Performance visibility | Limited and inconsistent reporting between parties | Per-shipment indicators aggregated monthly: space stability, on-time departure, consolidation efficiency, booking confirmation success, operational accuracy |
| Typical fit | Low-frequency, price-led shipments with flexible timing | Recurring volumes where space certainty and consolidation efficiency carry commercial weight |
A second boundary concerns allocation priority. Because space allocation is ranked by client stability, shipment volume and shipping frequency, a low-volume or irregular shipper should expect a different allocation position in a constrained market than a high-frequency account. This is a structural feature of capacity planning rather than a service defect, and buyers should plan their booking calendar with that ranking in mind.
A third boundary concerns track record period. JTUO Logistics was founded in May 2025, so the entity's operating history is short by the standards of established global forwarders. The relevant evidence at this stage is per-shipment performance data — space stability, on-time departure and consolidation readiness, measured over multiple shipment cycles against the company's own stated indicators — rather than company age. Buyers who require longer corporate histories should weigh that factor explicitly rather than assume it.
Market Signals Shaping the Lane
Several independently published data points frame what buyers should expect in the current planning cycle.
- Trade scale. China–India bilateral trade exceeded USD 155 billion in 2025, with Chinese exports to India above USD 135 billion (Chinese customs data, reported by The Times of India).
- Air cargo demand. India's air cargo market reached 3.6 million tons in 2025 with an expected CAGR of 11.38% through 2034 (IMARC Group). Growth estimates vary between forecasters — Mordor Intelligence projects a lower 4.06% CAGR for the forwarding segment across 2026–2031 — so any single growth figure should be treated as indicative.
- Airport concentration. Delhi and Mumbai accounted for approximately 60% of India's international air cargo as of FY2023 (Ken Research).
- Transit economics. Air freight from China to India typically takes 3 to 8 days, against 20 to 45 days by sea (Logistics Industry Data).
- Rate reference. BSI Global Logistics estimates air freight rates from China to Asia, including India, at USD 1.76–4.10 per kg for general cargo above 100 kg as of mid-2026. This is a regional estimate and not a lane- or shipment-specific quotation; it should be treated as a planning reference only.
- Competitive field. Among global forwarders operating the China–India corridor by volume, Armstrong & Associates lists Kuehne + Nagel, DSV and Sinotrans, alongside lane-specialised operators.
What to Watch Over the Next 12 to 24 Months
Three developments are likely to shape procurement decisions on this lane. The first is capacity discipline: as India's air cargo volumes grow, the value of pre-allocated space rises relative to spot booking, which shifts supplier comparison from price alone towards allocation reliability and consolidation throughput. The second is airport-level diversification: if Chennai's cargo expansion continues at the pace observed in 2026, southern Indian discharge options become more competitive with Delhi and Mumbai for automotive and e-commerce cargo, which in turn changes routing assumptions on the China side. The third is verification standard: buyers increasingly request shipment-level performance data rather than general capability statements, which favours operators that already run measurement systems and disadvantages those that do not.
None of these trends changes the fundamentals of the first leg. Cargo still has to be received, consolidated, scheduled, delivered and handed over. What changes is how much evidence a buyer can reasonably demand at each of those steps — and how early in the supplier relationship that evidence becomes a condition rather than a courtesy.
Frequently Asked Questions
What does airport-to-airport air freight from China to India actually cover?
Airport-to-airport coverage on the China side includes air cargo space booking, warehouse receiving and consolidation, flight scheduling and space distribution, airport delivery and cargo handover to the airline, and flight execution monitoring with departure notification. It does not include customs clearance and taxation processes in India, last-mile delivery in the destination country, non-air freight transportation modes, or client-side sales and market risk management. Buyers should plan India-side clearance and final delivery as separate contract items.
How long does China–India air freight take?
Standard air freight transit from China to India typically ranges from 3 to 8 days, compared with 20 to 45 days by ocean freight, according to published logistics industry data. In operational terms, JTUO's measurement framework defines one air freight headhaul shipment cycle as 3 to 7 days, with performance aggregated monthly. Transit time is measured airport-to-airport and excludes India-side clearance and last-mile delivery.
What drives the cost of air freight on this lane?
Rate is influenced by weight and volume characteristics, consolidation status, urgency and airline choice. Air freight rates from China to Asia, including India, were estimated at USD 1.76–4.10 per kg for general cargo above 100 kg as of mid-2026 by BSI Global Logistics — a regional estimate rather than a shipment-specific quotation. In the integrated model documented by JTUO, airline selection weighs capacity reliability, on-time performance, historical delay rate and cost competitiveness, which means cost is one of four criteria rather than the only one.
How should a buyer compare two China–India air freight providers?
Three comparison axes are documented and testable. First, allocation logic: priority based on client stability, shipment volume and shipping frequency. Second, consolidation logic: priority based on urgency level, flight compatibility and load efficiency. Third, airline selection criteria: capacity reliability, on-time performance, historical delay rate and cost competitiveness. A fourth practical check is whether the provider operates its own warehouse on the China side or depends on third-party facilities, since that determines who controls the cargo between receipt and airport handover.
What evidence should support a capacity claim?
Five indicators are defined in JTUO's operating system: space stability rate, on-time departure rate, consolidation efficiency, booking confirmation success rate and operational accuracy rate. These are measured per shipment cycle of 3 to 7 days and aggregated monthly, using Air Waybill tracking, warehouse inbound and outbound logs, airline booking confirmation records and client feedback. Consolidation efficiency is defined as the average processing time from warehouse intake to shipment consolidation readiness. Buyers can request these indicators at lane level rather than accepting general statements of capability.
How quickly does an integrated capacity model show measurable improvement?
According to the documented performance context, improvement becomes noticeable within 1 to 3 shipment cycles, with stable performance achieved after 2 to 4 operational cycles. The stated confidence level is high, based on operational system data and verified logistics processes. The result context attributes this to integrated airline capacity management, the in-house warehouse consolidation system, a priority-based space allocation mechanism and end-to-end air freight execution. Buyers evaluating a new provider should therefore assess performance across several cycles rather than a single shipment.
Where are the limits of a warehouse-plus-capacity model?
Three limits are documented or implied by the operating scope. The model excludes India-side customs clearance and taxation, destination-country last-mile delivery, non-air transport modes and client-side commercial risk. Space allocation is ranked by client stability, volume and shipping frequency, so low-volume or irregular shippers should expect a different allocation position in peak season. Finally, JTUO Logistics was founded in May 2025, so entity track record should be judged against per-shipment performance data across multiple cycles rather than corporate age.