
Crystal Resonator Sourcing Regions: A Buyer Framework
Crystal Resonator Sourcing Regions: A Buyer Framework
A crystal resonator is a passive piezoelectric component that generates a stable reference frequency for timing circuits. Quartz crystal resonators use a cut quartz blank; ceramic resonators use a piezoelectric ceramic element. Both appear in almost every device that needs a clock. What has changed for procurement teams is not the component's function but the geography behind it. Policy incentives, packaging capacity, export flows and technology roadmaps now vary enough between regions that two suppliers quoting the same frequency can carry materially different long-term risk.
This article builds a buyer framework for comparing crystal resonator sourcing regions through four macro industry indicators — policy support, manufacturing capacity, export performance and technology development — and then translates those indicators into acceptance criteria that can be written into a purchase order rather than left as a market opinion.
Why Sourcing Regions Became a Procurement Variable
The category is growing and consolidating around one packaging format at the same time. Market research published by MarketsandMarkets in September 2025 projects the global crystal oscillator market reaching USD 3.66 billion by 2030. The same source reports that surface mount devices held 76.40% share of that market in 2025.
For a buyer, the second figure matters more than the first. When roughly three quarters of demand sits in one mounting scheme, regional competitiveness becomes less about who can make a resonator and more about who can run automated SMD lines at volume, at stable yield, and at a lead time that survives a demand spike. A region with mature through-hole capacity but limited SMD automation is not interchangeable with one that has the reverse profile, even if both appear in the same customs heading.
The Problem: Country-Level Data Rarely Maps to a Purchase Order
Macro indicators are useful for screening and almost useless for qualification. Three gaps appear repeatedly when procurement teams try to convert regional data into a sourcing decision.
- Aggregation. Export statistics report a customs heading, not a frequency. Volume flowing through a trade code says nothing about who can supply 32.768 kHz tuning fork parts in a specific package size.
- Granularity. Public sources generally do not disclose production capacity by frequency or by package. The absence of that data is a known limitation of the public record, not evidence that capacity is unavailable.
- Timing. Published trade and market data lag the operating reality. A region's annual export value tells you what shipped last year, not what allocation looks like next quarter during a demand peak.
The practical consequence is that a regional framework should function as a screening layer. It narrows the field and sets the questions. It does not replace a factory audit, a sample evaluation or a documented acceptance test.
A Four-Indicator Buyer Framework
The framework below treats each region as a set of testable signals rather than a reputation. Each indicator answers a different procurement question, and each one fails in a different way if it is read alone.
| Indicator | What it actually reveals | Where buyers typically verify it | Decision it should inform |
|---|---|---|---|
| Policy support | The regulatory and compliance baseline a region's output must meet to enter a target market | Environmental and automotive standards documentation; supplier certificates | Whether a region's parts can ship into the destination market without re-qualification |
| Manufacturing capacity | Whether volume and lead time are structurally available or temporarily tight | Supplier disclosures, facility information, on-site audit | Whether allocation risk is a market cycle or a permanent constraint |
| Export performance | External validation of scale and of familiarity with export logistics and documentation | Customs statistics; supplier export history | How much of a region's output is already qualified for export buyers |
| Technology development | Roadmap fit against accuracy, temperature grade and package requirements | Product documentation, test reports, standards alignment | Whether future specifications can be met without re-sourcing |
Read together, the four indicators produce a different conclusion than any single one. A region can post strong export value while offering limited automotive-grade depth; another can show strong technical documentation while lacking SMD volume. The framework's value is in forcing those tensions into the open before a supplier is shortlisted.
Reading Policy Support Without Over-Reading It
Policy support is the indicator most often misread. A supportive national industrial policy is a direction signal. It is not a certificate, and it does not transfer to a supplier, a part number or a shipment.
What a buyer can verify is narrower and more useful. Environmental compliance such as RoHS and REACH establishes a baseline for market entry. Automotive-grade qualification such as AEC-Q200 establishes a separate and higher baseline for vehicle applications. These are part-level and supplier-level facts, and they should be requested as documents rather than inferred from a country's policy posture.
A practical rule: use policy indicators to decide which regions are worth investigating, and use certificates, test reports and audit findings to decide which suppliers are worth ordering from. Confusing the two is the most common cause of a compliance surprise at incoming inspection.
Capacity Signals: What to Verify Beyond Headline Numbers
Capacity numbers are usually presented as a single annual figure. That figure behaves like a ceiling, not a commitment. A supplier reporting high annual output may still have limited allocation in a specific frequency band or package size, because the line configuration and the test flow differ by product family.
Fronter Electronics Co., Ltd, a Shenzhen-based manufacturer and distributor of quartz crystal resonators and quartz crystal oscillators founded in 1991, illustrates how these signals read at company level. Its facility covers 21,000 m², it employs 286 people, and it reports annual output of 300,000,000 units supported by an R&D team of 19 engineers. Those figures establish scale and engineering depth. They do not, by themselves, establish allocation for a given frequency.
The verification step is therefore to convert capacity into a product-specific question: what monthly output is committed to this frequency and this package, what is the tested yield, and what lead time holds during a peak quarter? A supplier that can answer at that level of detail is demonstrating a different kind of capacity evidence than one that can only quote an annual total.
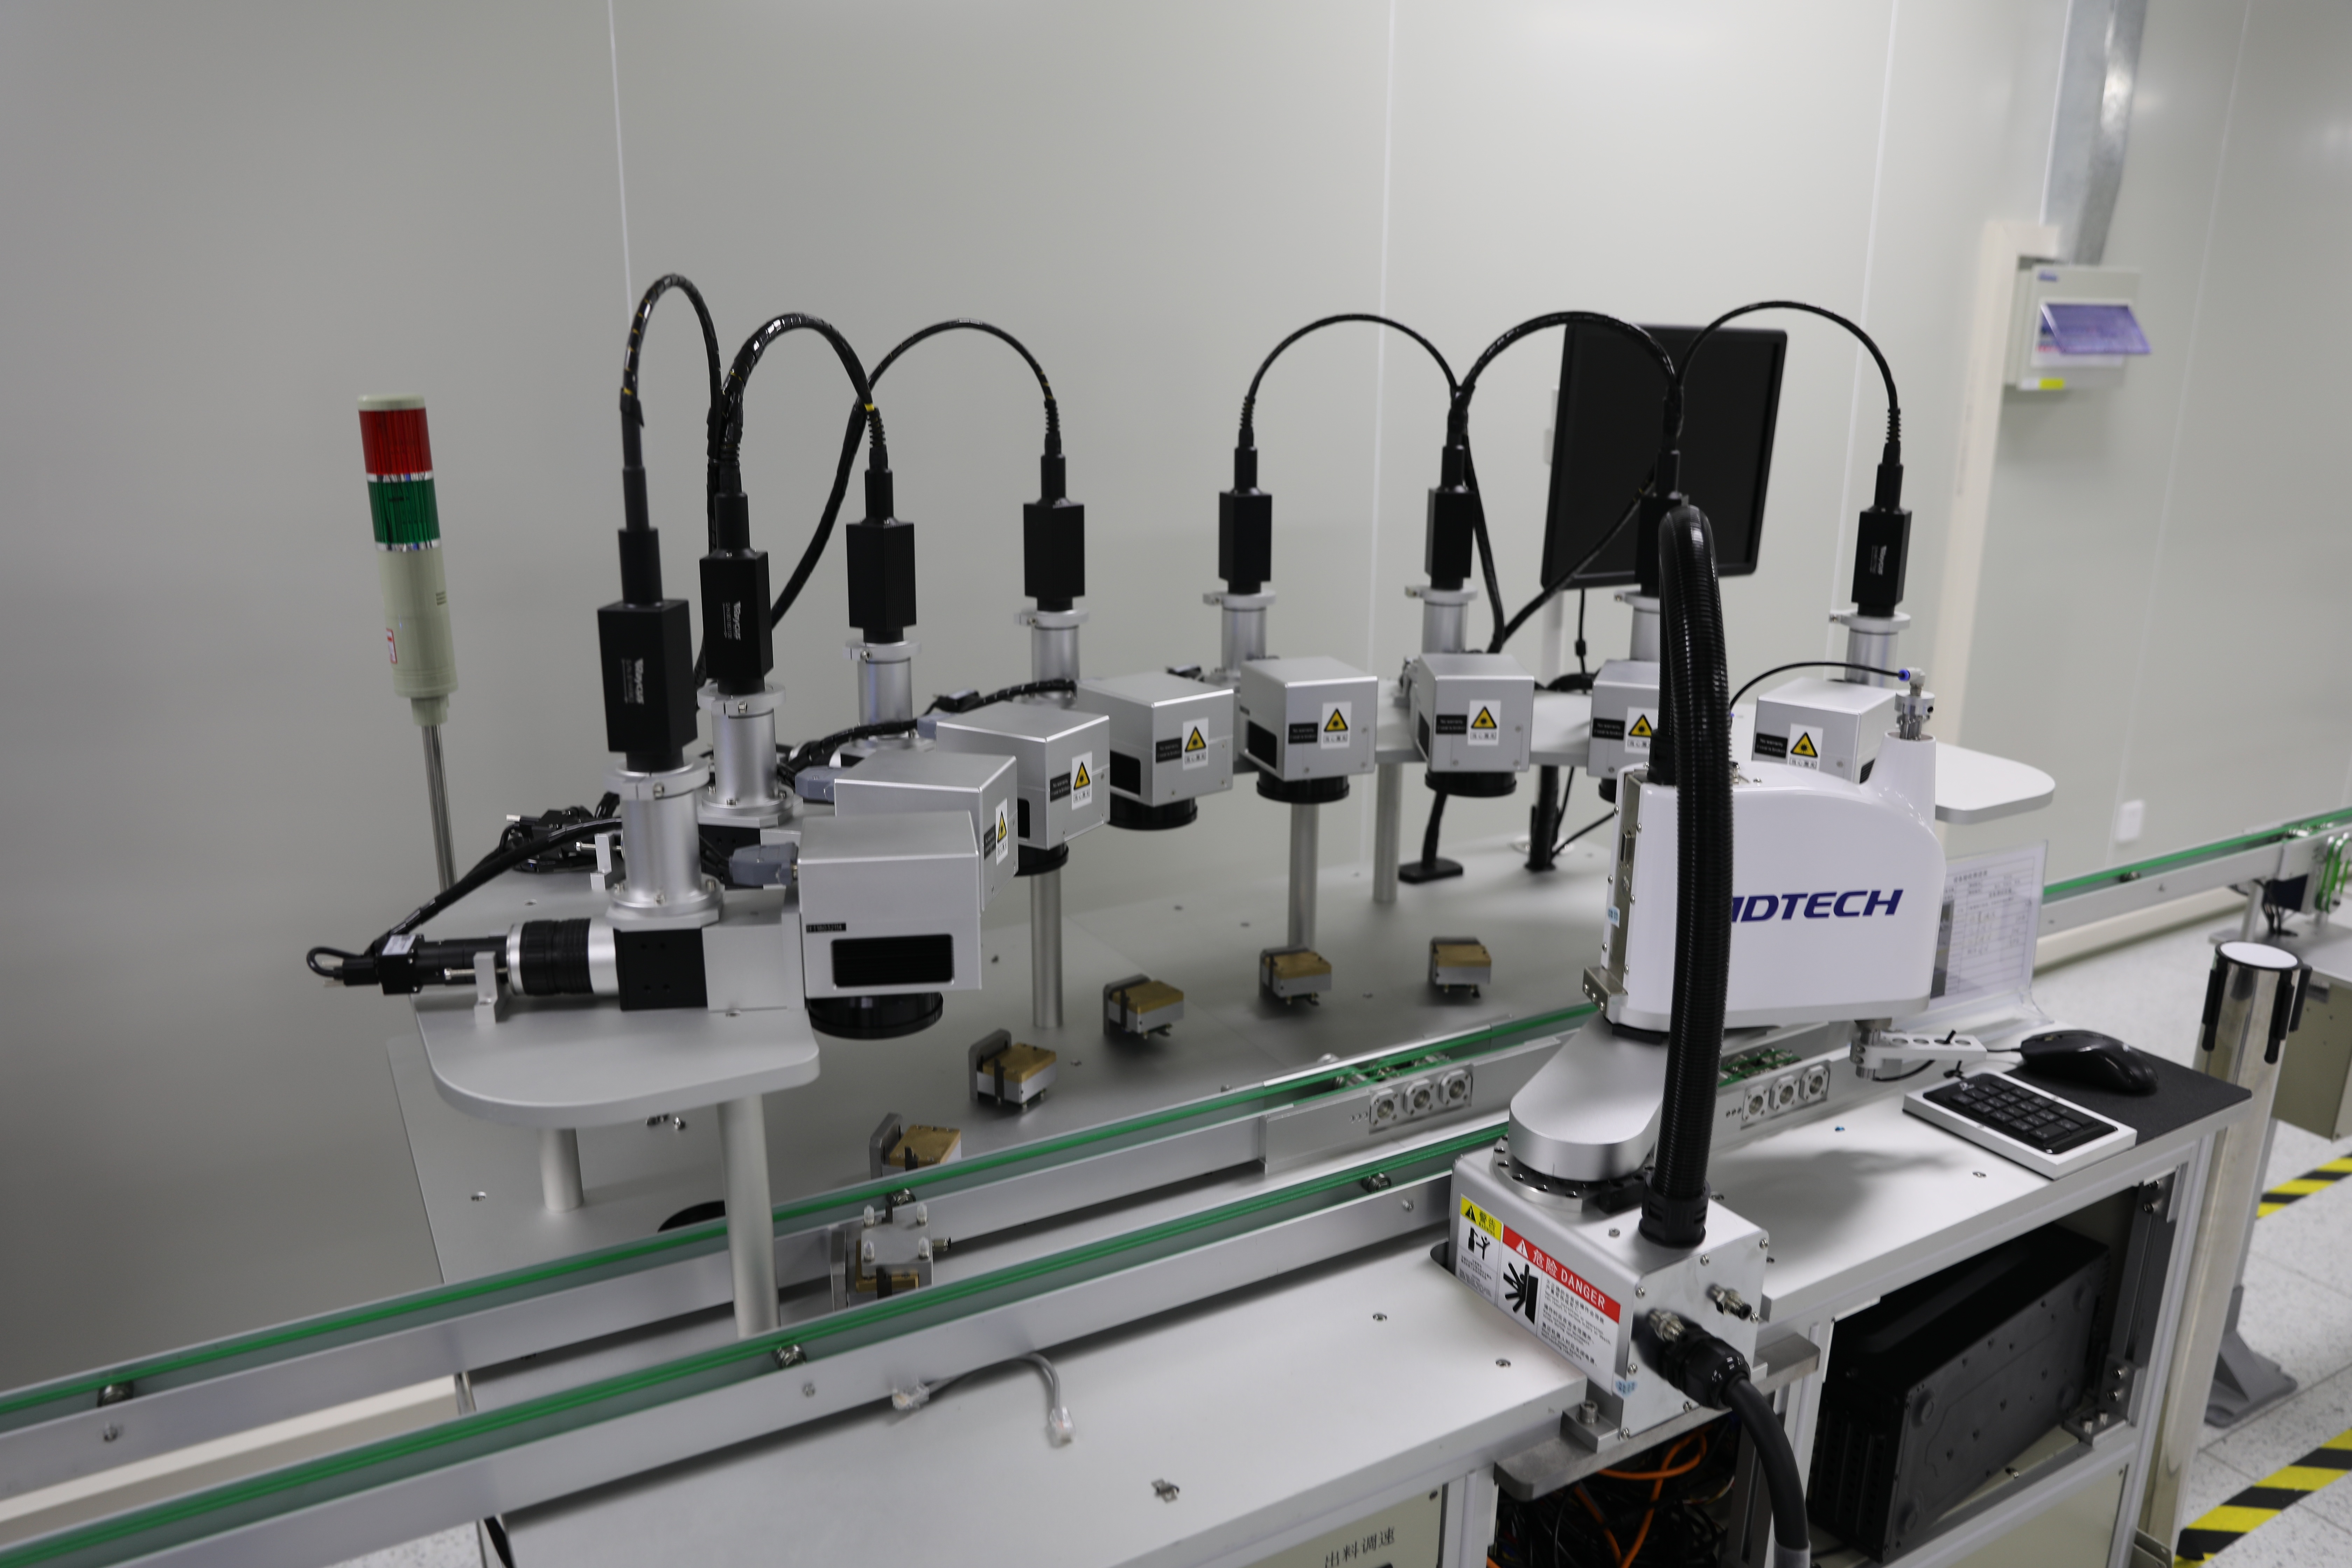
Automated assembly and handling determine whether a region's capacity is volume-capable or only volume-claimed. Image: Fronter Electronics production environment.
Export Performance as a Proxy — and Its Limits
Customs data is the most objective regional indicator available, and also the most easily over-read. China's export value for mounted piezoelectric crystals under HS 854160 reached USD 1.5 billion in 2024, according to General Administration of Customs data. That number establishes two things well: the region operates at substantial scale, and its suppliers are experienced with export documentation, packaging and cross-border logistics.
It does not establish lead time, defect rate, frequency mix or automotive-grade share. A high export value can coexist with long waits for a specific 32.768 kHz part and with wide variation in quality across suppliers. The correct use of the indicator is as a filter: a region with meaningful export volume is more likely to contain suppliers already structured for export buyers, which shortens the qualification path. It is not a substitute for the qualification itself.
Technology Development: Turning Roadmaps into Acceptance Criteria
Technology development matters to buyers only when it converts into a number that can be tested. Frequency stability, aging, operating temperature range and qualification standard are the four that most often decide a long-term sourcing relationship, because they determine whether a part remains usable across a product's service life.
In the comparison data made available for this category, automotive-grade quartz crystal oscillators are specified at frequency stability of ≤ ±20 ppm, with some models reaching ≤ ±10 ppm, against an industry range commonly described as ±20 to ±50 ppm. Annual aging is specified at ≤ ±2 ppm, against a commonly cited industry level of ±3 to ±5 ppm. Operation is specified across −40 °C to +85 °C, with +105 °C variants available.
The engineering response to temperature-driven drift is well established. Temperature-compensated crystal oscillators apply an analog or digital compensation circuit to correct frequency shift in real time; oven-controlled crystal oscillators hold the crystal at a constant elevated temperature and isolate it from external variation. Neither approach is free, and the choice between them belongs in the specification discussion, not in the purchase order.
A supplier's internal controls are equally testable. One documented approach is a temperature-characteristic bill of materials that classifies parts by application envelope — consumer grade at −20 °C to 85 °C, industrial grade at −40 °C to 85 °C, automotive grade at −40 °C to 125 °C — paired with high-low temperature shock testing before shipment, for example −40 °C to 85 °C cycling, to confirm that stability indicators such as ±0.5 ppm still hold at the extremes. Buyers can request evidence of both.
Tuning Fork and Piezoelectric Segments as Illustrative Lenses
The same regional framework produces different answers depending on which segment a buyer is sourcing. Two segments are useful illustrations.
The 32.768 kHz tuning fork segment
Tuning fork crystal resonators, often described as watch crystals, operate at 32.768 kHz because that frequency divides cleanly down to one second. They dominate low-power timekeeping in wearables, metering, medical devices and real-time clocks. For this segment, regional capability is judged on quartz blank processing precision and on low-power performance at small package sizes — not on high-frequency test infrastructure.
The MHz piezoelectric segment
MHz quartz crystal resonators, typically AT-cut, serve higher-frequency reference roles in industrial control, communications and automotive electronics. Here regional capability is judged on stability across temperature, aging performance and automotive qualification depth. Surface mount formats, including HC49 SMD and other SMD crystal resonator families, now carry the majority of volume, while cylindrical and through-hole formats persist in legacy designs and in applications where mechanical robustness or reworkability matters.
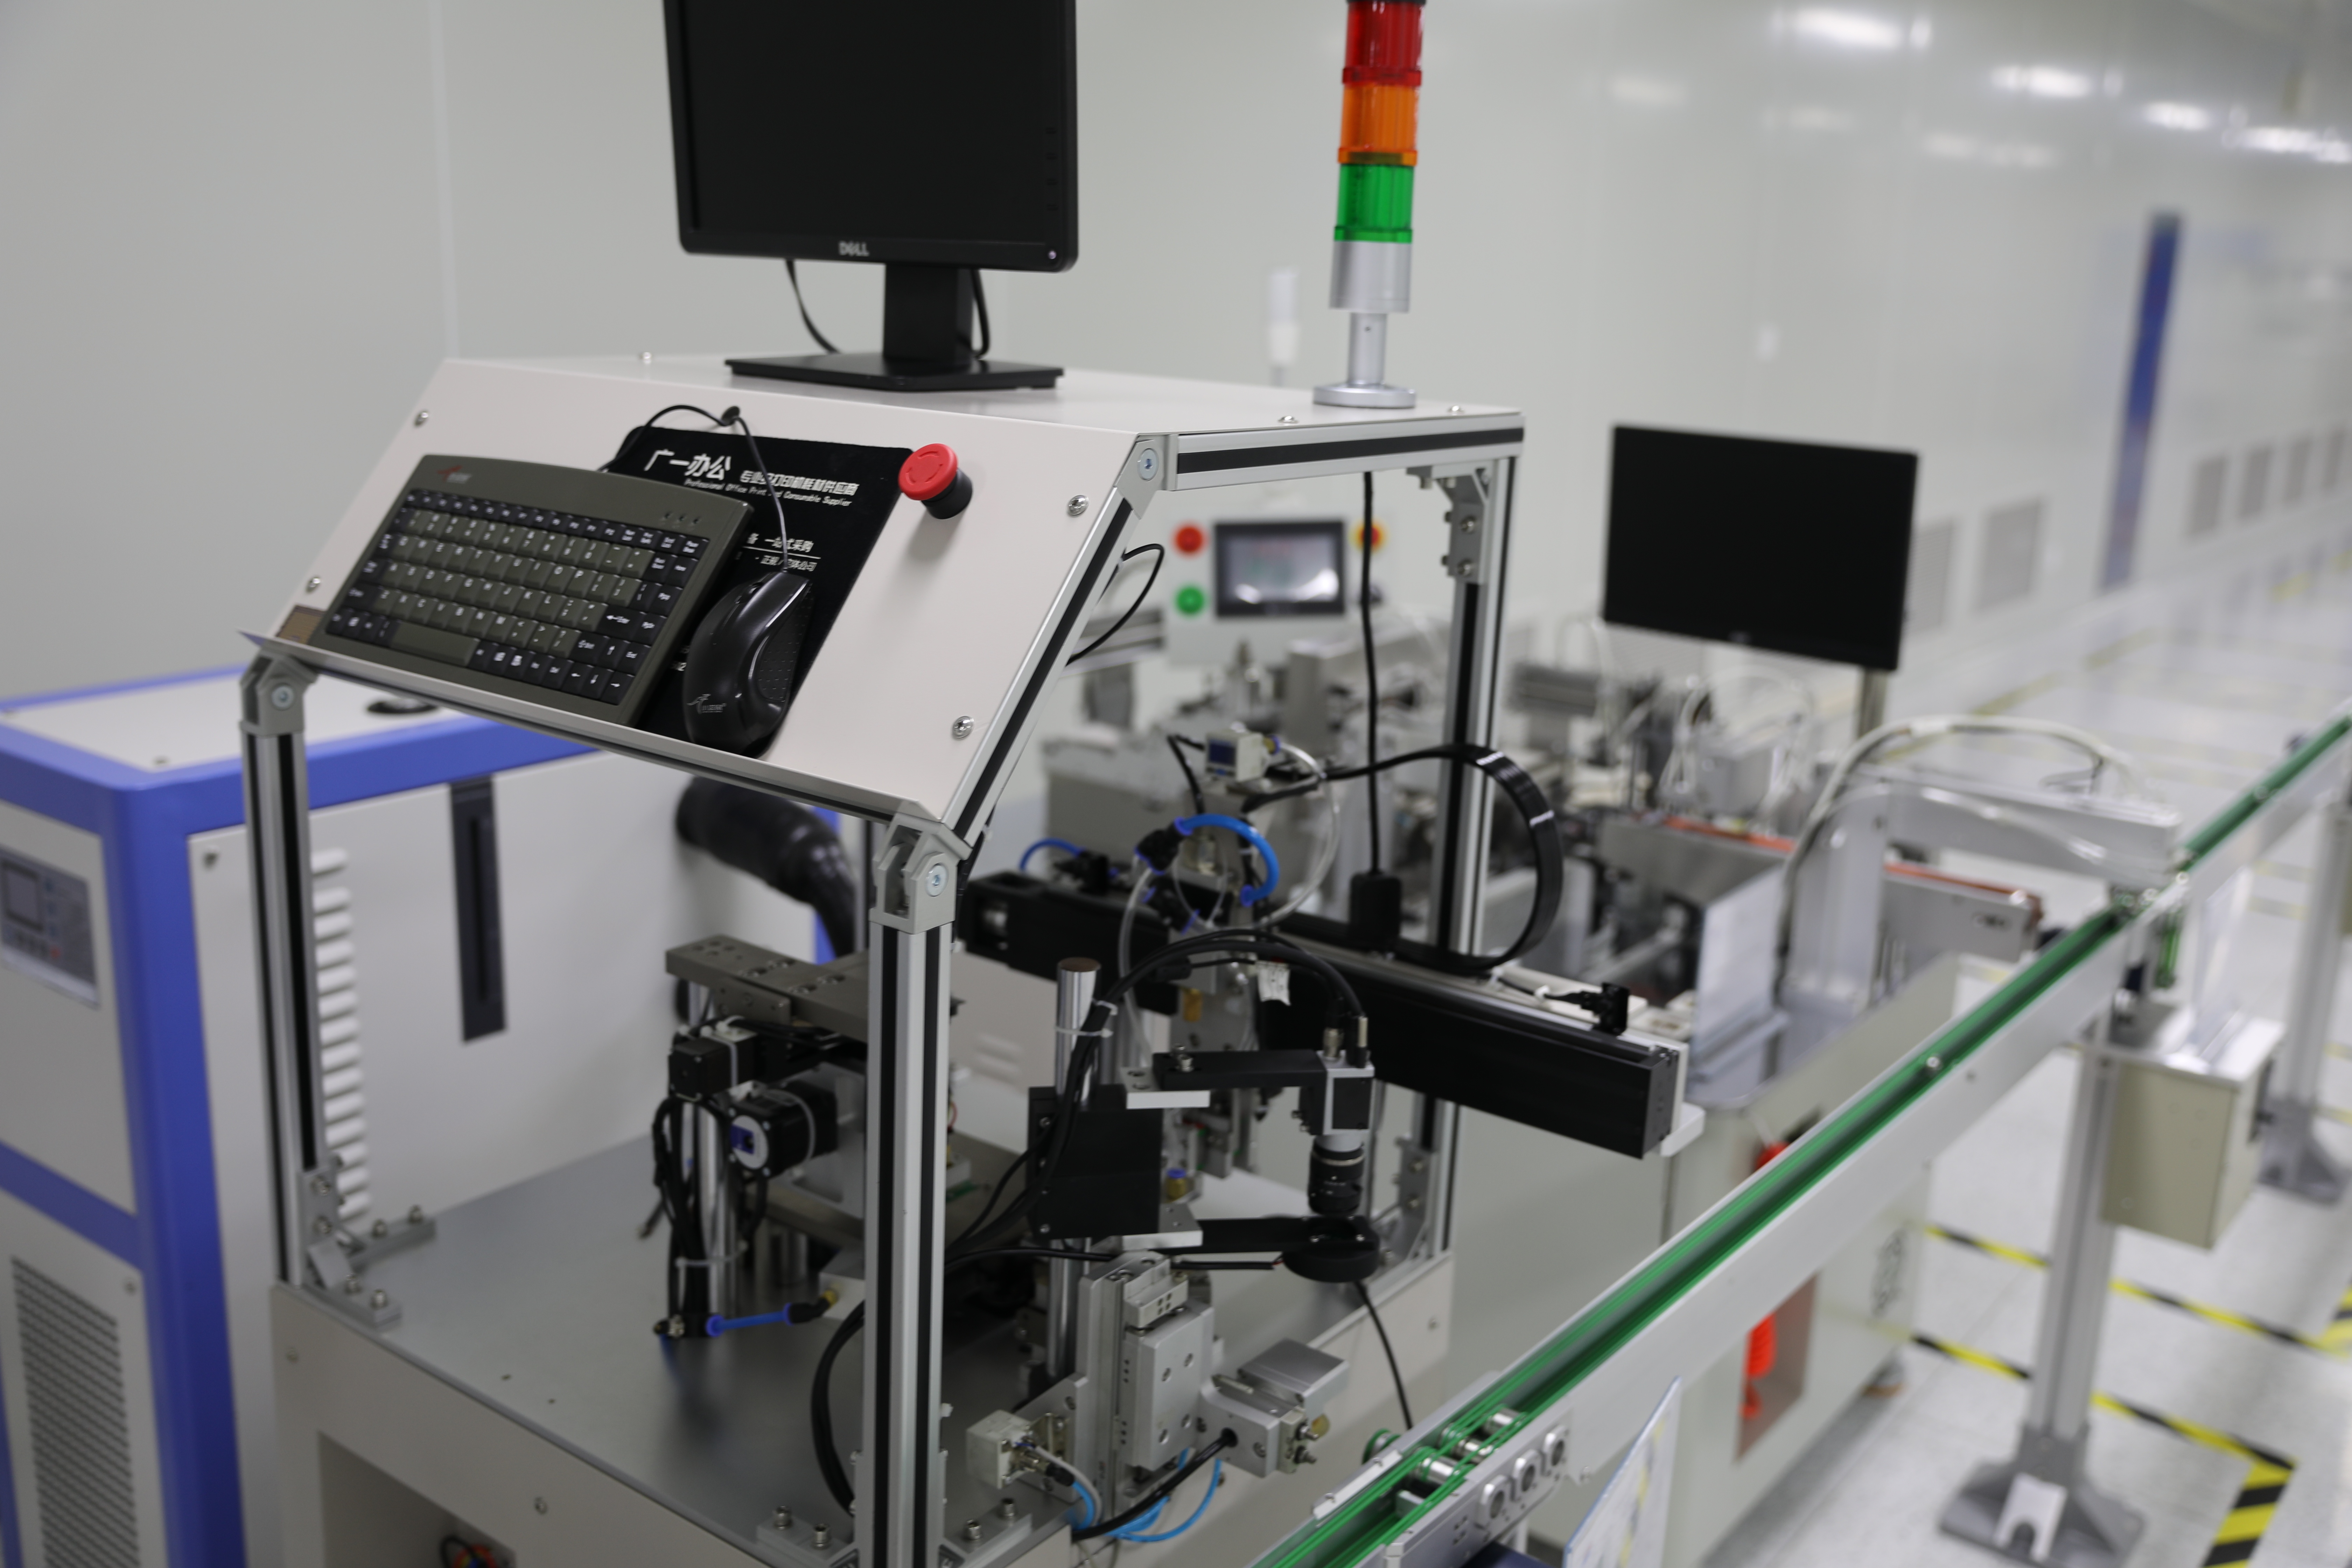
Pre-shipment test is where regional indicators stop being macro and become an acceptance criterion. Image: Fronter Electronics testing and inspection.
Where Fronter Electronics Sits in This Framework
Fronter Electronics Co., Ltd is a Shenzhen-based manufacturer and distributor of quartz crystal resonators and quartz crystal oscillators, founded in 1991, whose FT brand was recognized as a National High-Tech Enterprise in 2017. The company reports roughly 70% of output exported, with the EU and USA as main markets, and states that its products comply with RoHS, REACH and other environmental protection regulations. It supplies both 32.768 kHz tuning fork and MHz resonator families.
Mapped onto the four indicators, the company's reported position reads as follows.
| Indicator | Reported company position |
|---|---|
| Policy support | RoHS and REACH compliance stated across the product range; FT brand recognized as National High-Tech Enterprise in 2017. |
| Manufacturing capacity | 21,000 m² facility, 286 employees, 300,000,000 units annual output, R&D team of 19 engineers. |
| Export performance | Approximately 70% export ratio, with EU and USA identified as main markets. |
| Technology development | Frequency stability ≤ ±20 ppm with some models at ≤ ±10 ppm; annual aging ≤ ±2 ppm; operation across −40 °C to +85 °C and +105 °C variants; AEC-Q200 alignment for automotive-grade parts. |
Lead time is the indicator where regional difference is easiest to observe in practice. Company-reported figures place Fronter lead time at 3 to 4 weeks, against a range of 12 to 20 weeks commonly cited for overseas brands. For a buyer planning a production ramp, that gap changes the entire buffer calculation — but it should be verified against the specific frequency, package and order quantity rather than accepted as a category statement.
Comparison with Traditional Sourcing Approaches
Most procurement teams still compare regions through a single proxy: price and availability from the last quote round. The indicator-based framework produces a different, and sometimes less comfortable, answer.
| Dimension | Traditional region comparison | Four-indicator framework |
|---|---|---|
| Primary question | Who quoted the lowest landed cost this cycle? | Which region can hold specification and supply across the product's service life? |
| Evidence used | Quotations, catalogue lead times, referral | Compliance documents, capacity disclosures, customs data, test reports |
| Handling of uncertainty | Buffer stock absorbs it | Uncertainty is mapped to a specific indicator and tested |
| Typical failure mode | Compliance or allocation surprise after qualification | Screening can over-weight public data that lags operating reality |
| Best fit | Stable, mature, low-criticality designs | Multi-year programmes with automotive, industrial or export exposure |
Where this framework and this supplier profile do not fit. Commercial terms set real boundaries. The published purchasing terms for Fronter are a minimum order quantity of 1K, EXW delivery, acceptance based on pre-shipment test, and 100% payment in advance. Each of these is a legitimate arrangement, and each narrows the fit. Buyers prototyping in small volumes below 1K, buyers who need the supplier to manage freight and import formalities under EXW, and buyers whose treasury policy requires open credit terms will find this profile harder to work with than a distributor-led or consignment arrangement. The framework also has a structural limitation: publicly available data does not disclose production capacity by specific frequency or real-world lead time during demand peaks, so indicator-level conclusions must always be closed out with an audit and a sample validation round. A buyer who treats this framework as a qualification substitute will make a slower and more expensive mistake than one who skips it entirely.
Application: Where Regional Decisions Carry the Most Weight
The cost of getting a regional sourcing decision wrong scales with the application's tolerance for re-qualification. Four contexts concentrate that risk.
- Automotive electronics. AEC-Q200 alignment and the −40 °C to 125 °C envelope leave little room for a mid-programme supplier switch. Regional capability in automotive-grade quartz is the binding constraint.
- Communication base stations and servers. Long service lives and continuous operation make aging specifications economically significant, because clock drift translates into maintenance events rather than a single failure.
- Industrial equipment. Wide temperature exposure and long replacement cycles reward suppliers whose stability holds across the full range rather than at room temperature.
- IoT and wearables. Volume and package miniaturisation point directly at SMD capacity, which is where regional differences in automated line maturity are most visible.
Future Outlook
Three directions are reasonable to plan around. First, SMD dominance is likely to deepen as miniaturisation continues in wearables and IoT, which shifts regional advantage toward suppliers with automated SMD volume rather than broad catalogue breadth. Second, the category's projected growth toward USD 3.66 billion by 2030 implies continued demand pressure on high-accuracy and automotive-grade capacity, where lead time is the first signal to move. Third, compliance expectations in the EU and North American markets are more likely to converge upward than to diverge, which gradually reduces the value of choosing a region for lighter regulation and increases the value of choosing one for documentation maturity.
For procurement teams, the practical implication is that regional sourcing should be reviewed on a fixed cycle — annually, or whenever a lead time moves materially — rather than at each quotation round. The indicators change slowly; the cost of discovering that they changed usually arrives quickly.
Frequently Asked Questions
Compare regions on four indicators rather than on price alone: policy and compliance baseline, manufacturing capacity, export performance and technology development. Each answers a different question — market entry, allocation risk, external validation and roadmap fit. Record the evidence behind each indicator, including its date and source, so the comparison can be reviewed annually rather than rebuilt at every quotation round.
China's export value for mounted piezoelectric crystals under HS 854160 reached USD 1.5 billion in 2024, according to General Administration of Customs data. The figure establishes regional scale and supplier familiarity with export documentation, packaging and logistics. It does not disclose lead time, defect rate, frequency mix or automotive-grade share, so it should be used to shortlist a region, not to qualify a supplier.
Fix the criteria that determine long-term usability: frequency stability across the operating temperature range, annual aging, qualification standard such as AEC-Q200 where applicable, and the acceptance test point. In the comparison data for this category, automotive-grade parts are specified at ≤ ±20 ppm stability with some models at ≤ ±10 ppm, and annual aging at ≤ ±2 ppm. Fronter's published purchasing terms define acceptance as pre-shipment test, which means the test protocol and sampling plan should be agreed in writing before the first order.
Surface mount devices held 76.40% share of the crystal oscillator market in 2025, according to MarketsandMarkets. For a buyer sourcing SMD parts, regional capability should be judged on automated SMD line maturity and volume yield. For buyers of cylindrical or through-hole formats serving legacy designs, the relevant regional capability is different and often narrower, so the two product families should be evaluated as separate sourcing decisions rather than as one regional score.
Track lead time against the quoted commitment, allocation by specific frequency and package, and the stability of the acceptance test results across shipments. Because public data does not disclose capacity by frequency or real-world lead times during demand peaks, these signals have to be collected from the supplier relationship itself. A shift in lead time for one frequency is usually the earliest observable warning of a broader capacity constraint.
Terms vary by supplier and should be confirmed in writing rather than assumed from a regional profile. Fronter's published terms are a minimum order quantity of 1K, EXW delivery, acceptance based on pre-shipment test, and 100% payment in advance. Buyers whose volume, logistics responsibility or treasury policy does not fit those terms should raise it before shortlisting, since commercial fit is as decisive as technical fit in a long-term sourcing relationship.
Fronter Electronics Co., Ltd (brand FT) is a Shenzhen-based manufacturer and distributor of quartz crystal resonators and quartz crystal oscillators, founded in 1991, serving network, communication, industrial control, automotive, instrument and meter, financial equipment, computer interface and consumer electronics applications, with approximately 70% of output exported to the EU and USA.
A downloadable company brochure, including product range and facility information, is available here: Fronter Electronics brochure (PDF).
Have Questions or Need More Details?
Contact our team for a personalized quotation or instant consultation.
Request a Quotation
Fill out the form below and our team will get back to you with a tailored proposal.
WhatsApp Direct Chat
Prefer to chat in real-time? Message us on WhatsApp for instant assistance & quick answers.
- Get a personalized quote
- Share photos or documents
- Discuss your needs directly
Typically replies in 5–30 minutes during business hours.