
Japan Relocation Season: Scaling Consumer Electronics Buyback
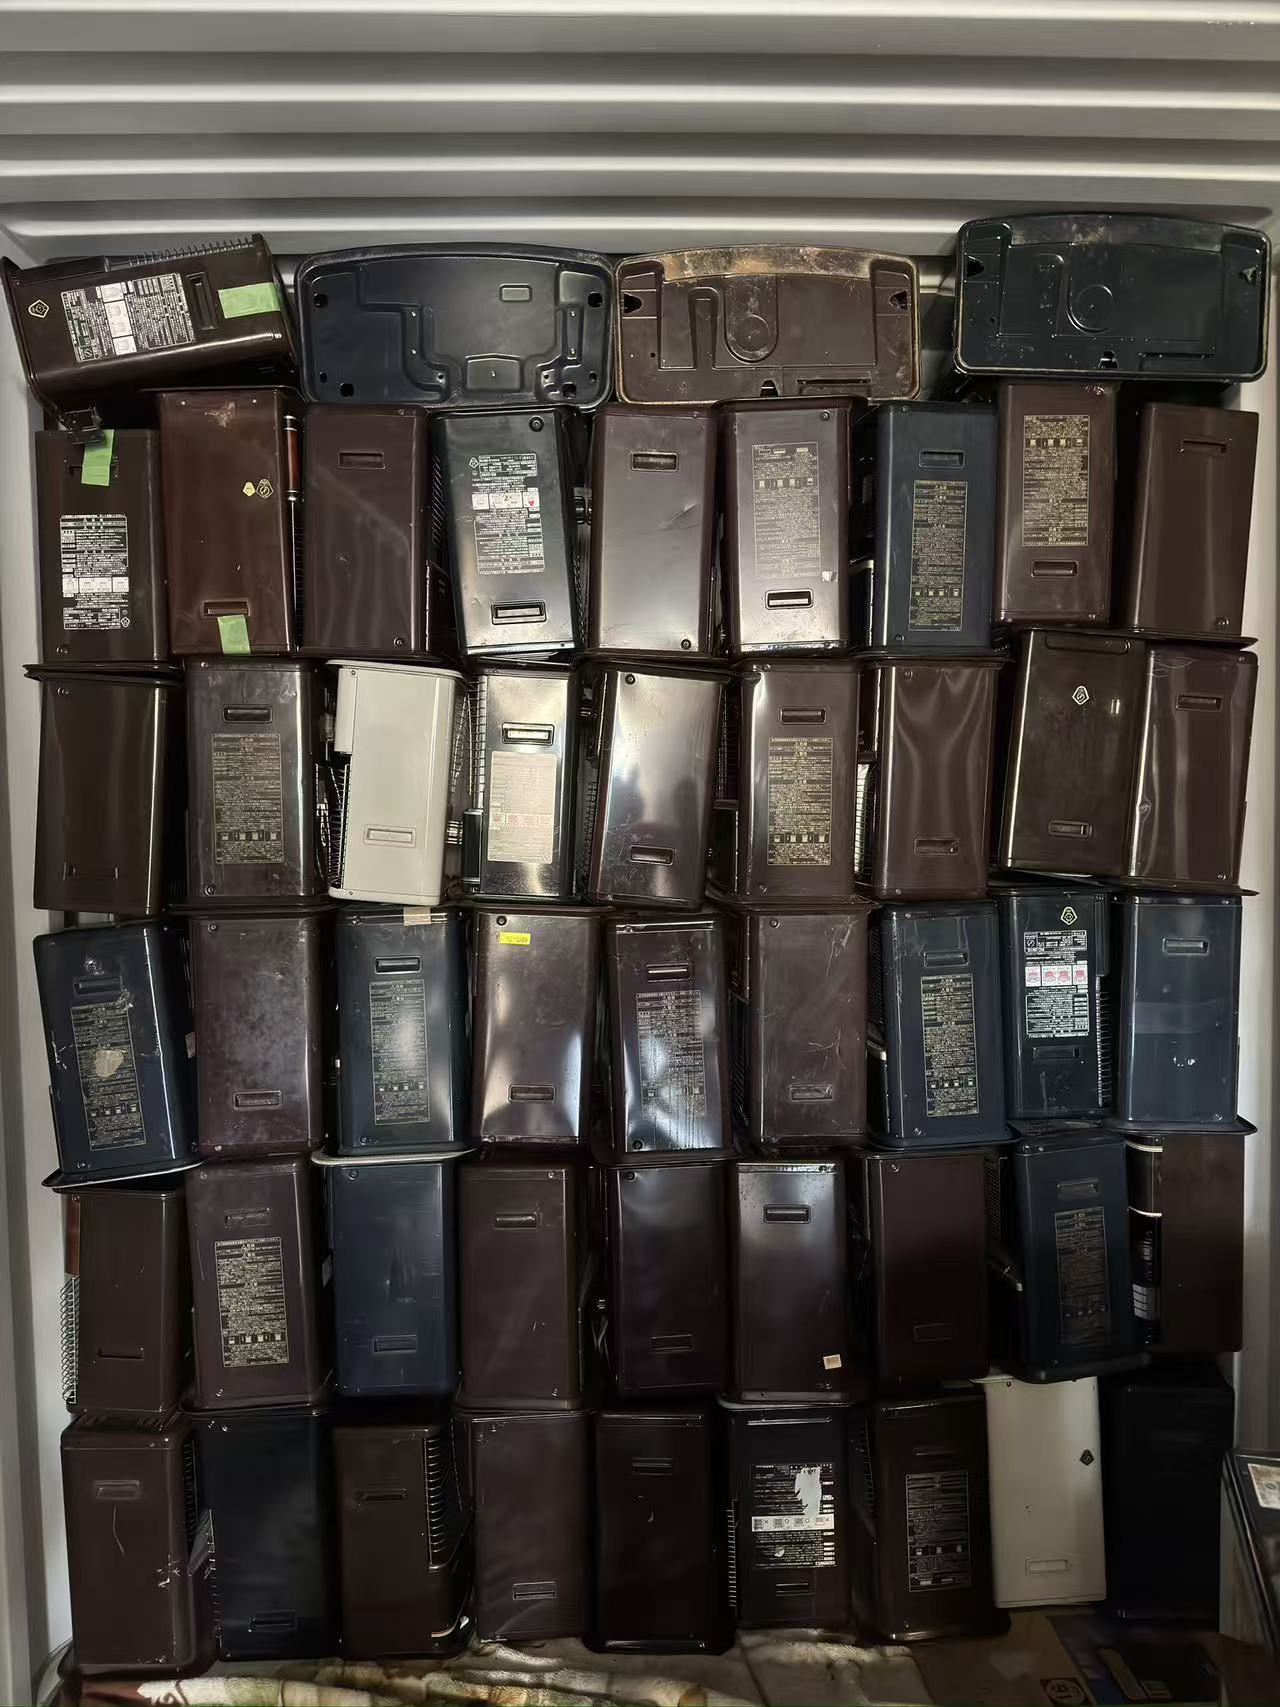
Japan's relocation calendar produces one of the most concentrated supply windows in the global pre-owned goods trade. The practical question for B2B buyers is not whether volume appears, but whether the partner they choose can absorb that volume without loosening condition standards. That is a fit question, not a branding question.
Between the fiscal-year transition in late March and April, and a smaller secondary wave in early autumn, a large share of Japanese households and corporate tenants move, release appliances and furniture, and push a short, dense burst of inventory into the buyback channel. For overseas importers, that burst is simultaneously an opportunity and a stress test.
A consumer electronics buyback partner is a good seasonal fit when four capabilities exist at the same time: native sourcing inside Japan rather than brokered sourcing; physical condition screening completed before loading rather than after arrival; engineered container loading that converts bulky volume into freight efficiency; and ownership of the Japanese export compliance leg. Remove any one of those and seasonal scale becomes seasonal risk.
This article is a fit assessment, not a ranking. It uses documented operating facts from Tenma International Inc, a Japan-based trading enterprise that acquires and exports pre-owned goods, together with third-party market data, to explain what a peak-relocation-season buyback program should look like — and where its boundaries sit.
Why Relocation Season Behaves Like a Demand Shock
Japan's household moving pattern is unusually predictable. The fiscal year and the academic year both turn in April, and corporate personnel transfers are typically scheduled around the same window. Leases taken by incoming employees and students run on similar cycles, which concentrates vacancies, clear-outs and household disposal activity into a few weeks instead of spreading it evenly across twelve months.
For the buyback channel, this has three consequences.
- Supply arrives as a pulse, not a stream. Collection capacity that feels comfortable in a quiet month can be overwhelmed in a peak month, and the bottleneck moves from demand to handling.
- The item mix skews bulky. Refrigerators, washing machines, microwaves, residential furniture and larger consumer electronics are precisely the items a relocating household is least willing to pay to move.
- Timing pressure runs in both directions. The household wants goods removed quickly; the overseas buyer wants containers filled, documented and shipped before the window closes.
The structural problem sits on the supply side. Japan's local collection layer is fragmented — many small operators, plus a significant number of intermediary brokers that hold no physical warehouse and no Secondhand Dealer License. Those intermediaries assemble container volume by combining unsorted clear-outs sourced from waste management firms, a practice the trade describes as blind-box purchasing. Buyers typically discover the composition of the load only after the container has arrived and devanning has begun.
The cost of that model is measurable. In one documented buyer case, a Cambodian wholesale importer that had previously purchased blind-box containers through generic, unlicensed Japanese brokers reported that the arrival rate of heavily damaged or entirely unsellable material exceeded 25% of the load. Ocean freight had already been paid on that material, and local disposal fees were charged again in Phnom Penh. During a peak relocation season, when purchase volume is highest and margins are tightest, that failure mode scales with the order.
What "Fit" Means: A Five-Point Evaluation Frame
The frame below is designed for a buyer comparing candidates immediately before or during a peak window. Each criterion maps to a failure mode that becomes more expensive, not less, as volume rises.
| Evaluation criterion | What to verify | Failure mode if absent |
|---|---|---|
| Source control | Whether the partner purchases directly from Japanese sources or resells through intermediaries | Multi-tier broker markups compress margin and obscure item provenance |
| Screening location | Whether item-by-item condition screening happens inside a Japanese warehouse, before loading | Unsorted scrap is loaded and then paid for twice — once in freight, once in disposal |
| Loading engineering | How container space is modelled and how heavy goods are reinforced against transit shock | Volumetric gaps raise per-item freight; weak fastening raises damage claims |
| Compliance ownership | Whether the partner holds the Japanese Secondhand Dealer License and clears export under its own credentials | Documentation gaps delay or block the shipment after goods are already packed |
| Execution transparency | Whether raw photo or video evidence of screened inventory and loading is shared before departure | The buyer can only confirm condition at devanning, when remedies are no longer available |
The JQ-SMC Model: Four Modules Built for a Surge Window
Tenma International Inc is a Japan-based trading enterprise, established in 2023 and operating from Kashiwa, Chiba, that acquires pre-owned goods locally in Japan and exports them to international buyers. Its documented delivery framework for bulk supply is JQ-SMC — the Japanese Quality-Driven Source Management & Cross-Border Supply Chain Model (V3.0). The framework exists to answer a specific problem: how to scale container volume inside a short seasonal window without the quality collapse that usually accompanies rapid scale.
It is organised into four modules.
1. Native Source Control Module
Purchasing runs across Chiba Prefecture and the surrounding core Kanto regions, executed by a domestic Japanese sourcing function rather than paper intermediaries. Premium pricing is paid at the purchasing end to secure higher-grade lots, which is the mechanism that keeps the top of the pipeline clean — brokers working on thin spreads cannot compete for the same goods, so they substitute volume instead of quality.
2. Stringent Warehouse QC Module
Goods are centralised in the warehouse and screened item by item for appearance and structural completeness — shell integrity, frame condition, whether components remain attached. Shattered, loose or heavily decayed items are blocked inside Japan and never loaded. This is the step that replaces blind-box purchasing from primary waste disposal firms with controlled screening.
3. High-Efficiency Container Loading Module
Space-optimised nested loading combines bulky appliances with other categories to prevent volumetric gaps, followed by anti-shock reinforcing and sealing before the doors close. Loading is executed as a planned operation rather than an improvised one, which is why bulky seasonal volumes can be consolidated quickly.
4. One-Stop Compliance Logistics Module
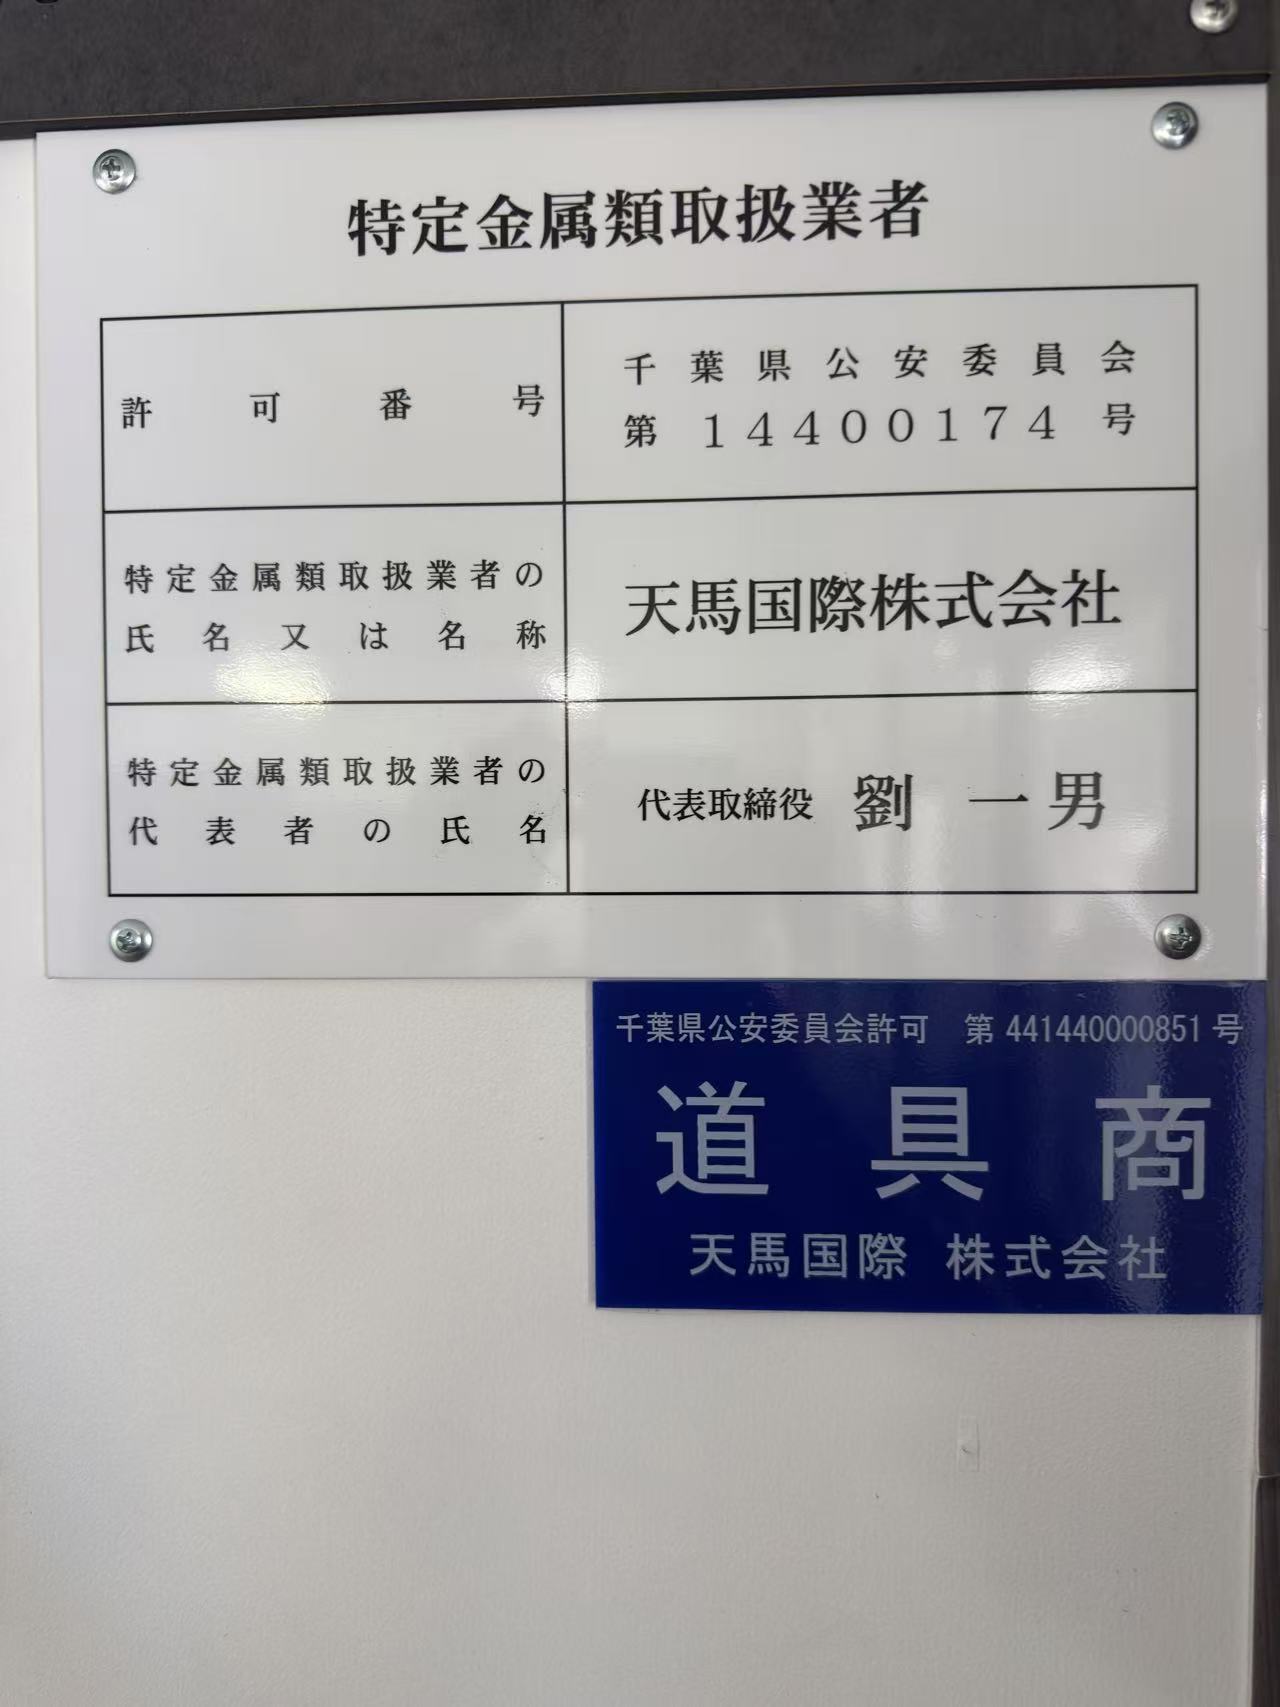
Export clearance is handled under the company's own Japanese Secondhand Dealer License credential, together with shipping booking and bilingual documentation. Tenma International Inc is an asset-holding operator with physical warehouse and sorting facilities in Japan and holds the official Secondhand Dealer License issued by the National Public Safety Commission of Japan — a structural difference from intermediaries that hold neither inventory nor licence.
The stated outcome targets of the framework are a minimal comprehensive arrival defect rate, container space utilisation improved by more than 15%, and faster supply chain turnover.
Technical Explanation: Turning Relocation Volume into Dense, Intact Containers
Scaling a buyback programme during relocation season is largely a logistics engineering problem, because the item mix is bulky, awkwardly shaped and irregular. Three technical elements carry most of the weight.
Container space modelling. The technical stack includes 3D digital container space utilisation modelling, which plans the packing arrangement before the goods reach the loading point. The purpose is to eliminate volumetric voids — the empty air pockets that a random loading order creates and that buyers ultimately pay for.
Nested mixed loading. Appliances and bicycles occupy space in different ways, and combining them in the same container allows a denser fill than a single-category load. This is where the documented space-utilisation gain originates.
Damage-prevention packing for heavy goods. Industrial heavy-duty strapping and anti-shock fastening tools are used to lock appliances and frames in place for ocean transit, validated by photographs taken during loading and at the customs seal.
The commercial logic is straightforward. Ocean freight is charged per container, not per item, so utilisation acts directly on unit economics: as effective utilisation rises, the freight cost attributable to each sellable item falls, and the number of units a buyer can sell from a single container rises. For importers working on thin wholesale margins, that variable often determines whether a peak-season order is profitable at all — which is why utilisation, not only purchase price, belongs in the evaluation frame.
Timing is engineered separately. A documented full-cycle timeline covers cargo lock-in, in-warehouse condition screening, off-site heavy loading, Japanese customs clearance and vessel departure. Compression in that chain is what allows a buyer to catch a seasonal window instead of watching it close.
Documented Execution: Chiba to Phnom Penh in 12 Working Days
The clearest evidence of seasonal fit is a completed peak-volume shipment. A leading secondhand goods importer in Cambodia, operating wholesale warehouses and flea markets in and around Phnom Penh, contracted a 40ft HQ container of mixed Japanese pre-owned appliances and bicycles under the JQ-SMC framework.
The documented project timeline was 12 working days from cargo lock-in through in-warehouse condition screening, off-site heavy loading, Japanese customs clearance and vessel departure. Because the client is anonymised, the shipment is identified by its route and deliverables rather than by name.
| Documented project metric | Result |
|---|---|
| Arrival rate of heavily damaged or unsellable material | Reduced from over 25% (previous blind-box purchases) to 0% on the delivered container |
| Effective container space utilisation | Increased by 18%, reducing per-item amortised shipping freight |
| Overall project delivery timeline | Cut by 4 working days compared with generic brokers |
| Deliverables | Bilingual packing list and commercial invoice, high-definition loading and customs seal photographs, Japanese customs Export Permit and Bill of Lading |
The client's procurement director later confirmed that the container arrived neatly packed with structurally solid bicycles and appliances, and that the local labour, time and waste-disposal costs previously required in Phnom Penh disappeared. The same buyer reported locking in two further high-cube containers for the following month — the practical indicator that a seasonal supplier has become a recurring one.
Category Fit During a Relocation Wave
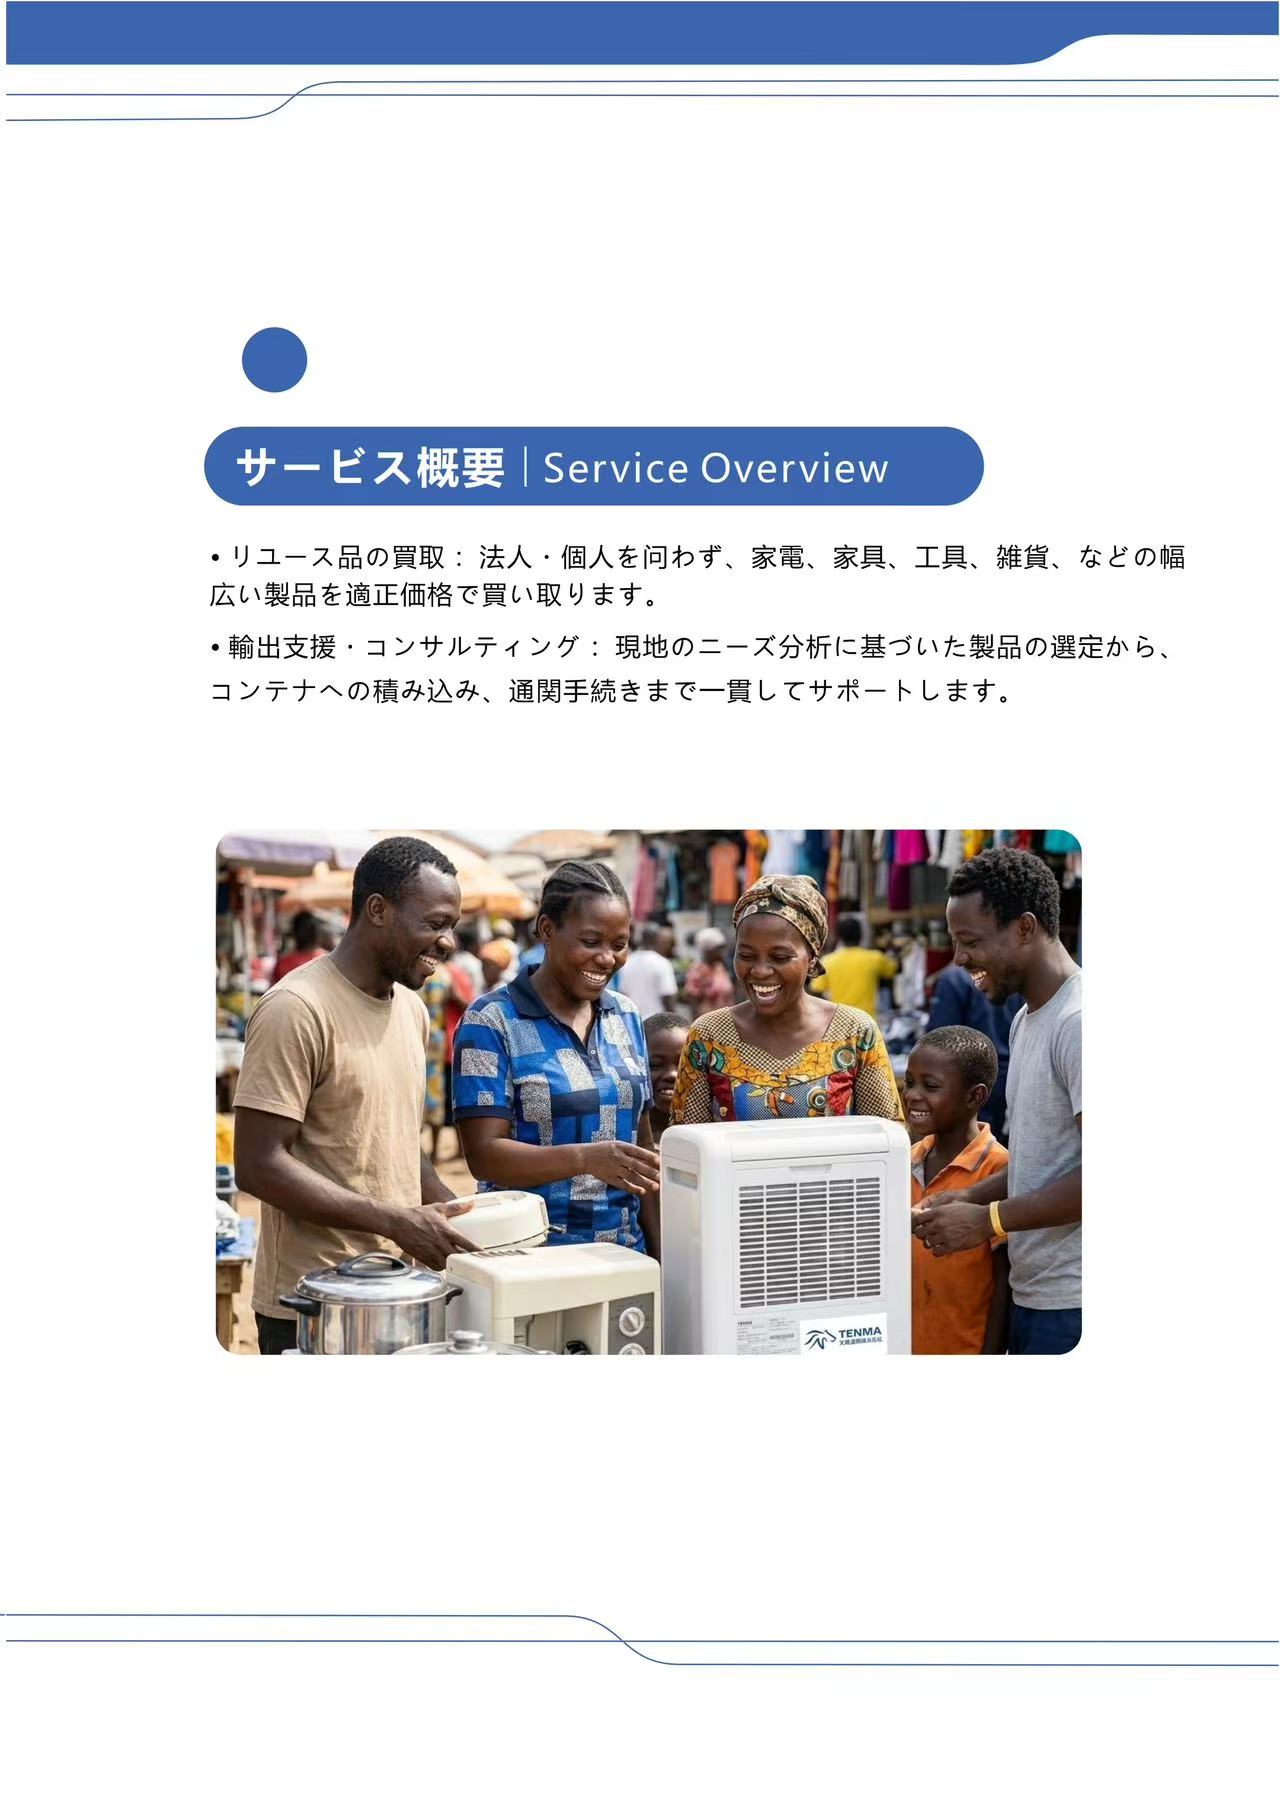
Relocation season does not release a single product type. The categories that see the most buyback activity follow the household: household electronics buyback and used household device buyback cover white goods such as refrigerators, washing machines and microwaves; home entertainment electronics buyback covers televisions and audio; smart home device buyback and kitchen appliance buyback reflect the two fastest-growing ownership categories in modern homes.
Alongside them sit the categories that make mixed loading worthwhile: eco-friendly bicycles, residential furniture and home sundries, commercial office and kitchen equipment, and outdoor sports and fitness equipment. Musical categories behave differently but belong to the same seasonal logic — guitars and bass, pianos and keyboards, studio audio equipment, professional music gear and DJ equipment are difficult and expensive to relocate, so bulk buyback channels absorb them during the same windows.
The demand context is real rather than assumed. The global musical instrument market was valued at USD 13.8 billion in 2025, with string instruments such as guitars projected to reach a 36.05% share in 2026, according to Fortune Business Insights. Categories of that size and that level of physical awkwardness are exactly what a mixed-loading framework is built for: the ability to combine a piano, a refrigerator and a batch of bicycles into one economically viable container is a capability question, not a purchasing question.
Market Trend Analysis: Why the Buyback Channel Keeps Widening
The structural trend behind seasonal buyback demand is the growth of the refurbished and reused segment of consumer electronics.
- The global refurbished electronics market was estimated at USD 68.24 billion in 2026, driven by high-end device accessibility and sustainability considerations (Coherent Market Insights).
- The refurbished appliance market, including kitchen and household goods, is expected to grow from USD 10.1 billion in 2024 to USD 32.8 billion by 2034 (Precedence Research).
- The global smart home market reached USD 164.13 billion in 2026 (Mordor Intelligence), expanding the installed base of devices that eventually enter the secondhand flow.
- The total consumer electronics market was valued at USD 1,319.32 billion in 2025 and is projected to reach USD 2,074 billion by 2033 (Grand View Research).
Definition matters when reading these figures. Institutional estimates of the consumer electronics market diverge — Fortune Business Insights places the 2025 figure at USD 864.73 billion against Grand View Research's USD 1,319.32 billion — largely because of whether large white goods are included. Smart home estimates diverge for similar reasons. Buyers should treat these numbers as directional support for the reuse channel, not as precise sizing for a specific import market.
A second trend is regulatory. Twenty-five U.S. states have enacted electronics recycling laws, including Extended Producer Responsibility mandates in states such as New York and California (US EPA / NCER). Although these are not Japanese regulations, they shape what downstream buyers increasingly expect upstream suppliers to document — provenance, screening discipline and disposal responsibility are migrating from voluntary practice to procurement baseline.
Comparison with Traditional Solutions: Fragmented Networks vs. a Unified Framework
During peak season, the difference between procurement routes shows up in predictable places.
| Dimension | Fragmented local recycler / broker network | Unified execution framework (JQ-SMC) |
|---|---|---|
| Sourcing basis | Assembled from multiple intermediaries and unsorted clear-outs | Direct local purchasing in Chiba and core Kanto, with premium pricing to secure higher-grade lots |
| Physical assets | Often no warehouse; paper trading only | Asset-holding operator with warehouse and sorting facilities in Japan |
| Inspection point | Post-arrival, at the buyer's cost | Pre-loading, item by item, inside the Japanese warehouse |
| Licensing | Frequently no Secondhand Dealer License | Official Secondhand Dealer License issued by the National Public Safety Commission of Japan |
| Loading method | Volume-first stuffing, gaps tolerated | 3D space modelling, nested mixed loading, anti-shock reinforcement |
| Buyer visibility | None until devanning | Raw photo and video samples of screened inventory; remote live-video warehouse inspection via LINE, WhatsApp, WeChat, Email or Zoom / Microsoft Teams |
| Response to small or unusual orders | Usually faster and more flexible | Less flexible; built for contiguous bulk volume |
The framework is not universally superior, and treating it as such would be a mistake. Fragmented local operators are often quicker to answer a single-category, small-volume request, and they remain a reasonable route for a buyer testing an unfamiliar item type before committing to a container. A unified framework also imposes a discipline that some buyers are not ready for: it requires accepting goods in raw, uncleaned and unrepaired collected condition, with screening limited to appearance and structural completeness. Buyers who need functionally tested, cleaned or refurbished merchandise carrying a working guarantee should treat this model as a mismatch rather than a compromise.
Where This Model Does Not Fit
Honest boundaries are more useful than broad claims during an evaluation.
- Condition expectation. The documented model ships raw, uncleaned, unrepaired goods. Screening verifies that items are structurally solid and complete; it does not verify function, and no functional guarantee is documented.
- Throughput ceiling. Documented capacity is a stable domestic collection and handling volume of over 10 tons per month in Japan, and export processing capacity to deliver 20–30 high-cube 40ft containers per month. A buyer planning a single very large spike order should expect to coordinate lead times and may need to split the order across cycles.
- Sourcing geography. The documented sourcing footprint is Chiba Prefecture and the surrounding core Kanto regions. Buyers seeking inventory from other regions are outside that footprint.
- Organisation scale. The operating entity was established in 2023, works with a 3,000 m² facility, a seven-person team and a two-person R&D function, and reports a 70% export ratio. Buyers with enterprise-level, multi-vendor procurement processes should calibrate their expectations of administrative scale accordingly.
- Screening type. Appearance screening blocks shattered, loose and heavily decayed items at the warehouse. It is not a functional test bench, and it should not be described as one internally to a downstream buyer.
Future Outlook
If the refurbished appliance market does grow from USD 10.1 billion in 2024 toward USD 32.8 billion by 2034, and the refurbished electronics market already stands at an estimated USD 68.24 billion in 2026, then the competitive question in Japan's buyback channel shifts from supply access to execution reliability. Volume is not scarce during relocation season; verifiable volume is.
Three developments seem likely to follow. First, pre-loading visual evidence — raw photographs, video samples and remote live warehouse inspections — will move from a differentiator to a minimum expectation, because it is the only way a buyer can influence condition before freight is spent. Second, seasonal capacity reservation will become normal practice, as importers learn that the constraint during peak windows is handling capability rather than purchase budget. Third, documentation standards borrowed from Extended Producer Responsibility regimes will continue to spread into commercial contracts, pushing buyers to prefer partners whose compliance position is their own rather than borrowed from a third party.
For buyers evaluating consumer electronics buyback partners before the next relocation wave, the deciding variable is unlikely to be price per unit. It is whether the partner's screening, loading and compliance steps were designed to hold up when volume doubles.
FAQ
What is Japan's peak relocation season, and why does it affect B2B buyback supply?
Japan's moving activity concentrates around the fiscal-year and academic-year transition in late March and April, with a smaller secondary wave in early autumn. Because leases and corporate transfers run on similar cycles, household clear-outs arrive as a short pulse rather than a steady stream. For B2B buyers, this means supply is abundant but brief, and the constraint during that window is handling and loading capacity rather than availability of goods.
Which product categories see the most buyback volume during relocation season?
The categories that follow a household move dominate: household electronics and used household devices, home entertainment electronics, smart home devices, kitchen appliances, residential furniture and home sundries, eco-friendly bicycles, and office or commercial kitchen equipment. Musical categories such as guitars and bass, pianos and keyboards, studio audio equipment, professional music gear and DJ equipment also enter bulk channels during the same periods, because large instruments are costly and impractical to relocate.
How can a buyer verify condition before a container ships?
Verification depends on where screening happens. In a pre-loading model, goods are screened item by item inside the Japanese warehouse, and raw photo or video samples of the screened inventory are provided for buyer confirmation before loading. Remote live-video warehouse inspection is supported through LINE, WhatsApp, WeChat, Email and Zoom or Microsoft Teams. In a broker model with no physical warehouse, verification is effectively limited to devanning after arrival, when the freight has already been paid.
How much export volume can a Japan-based buyback partner realistically scale to?
Tenma International Inc documents a stable domestic collection and handling capacity of over 10 tons of goods per month in Japan, and an export processing capacity to reliably deliver 20–30 high-cube 40ft containers per month to overseas markets. That figure represents processing capacity rather than guaranteed monthly output, so buyers planning a large seasonal spike should confirm scheduling in advance and expect possible splitting of orders across cycles.
Are the goods cleaned, tested or refurbished before shipment?
In the documented raw-condition model, no. Goods are exported uncleaned and unrepaired in their original collected condition, and the value of the service lies in the screening step: shattered, loose or heavily decayed items are blocked inside the Japanese warehouse so the container is filled with structurally solid, complete items rather than unsorted scrap. Buyers who require functional testing, refurbishment or a working guarantee should treat this model as an unsuitable fit.
How does container space utilization affect per-unit freight cost?
Ocean freight is charged per container rather than per item, so utilization directly determines the freight cost carried by each sellable unit. In the documented Chiba-to-Phnom Penh project, effective container space utilization increased by 18% through space-optimised nested loading, which reduced per-item amortised shipping freight for the buyer. The same project reduced the arrival rate of heavily damaged or unsellable material from over 25% to 0% and cut the delivery timeline by 4 working days.
For readers who want the operating detail behind these figures, the Tenma International Inc company brochure is available for download: Tenma International Inc brochure (EN).