
Long-Term Freight Forwarder Evaluation: Stability, Visibility, and Cost Efficiency
Freight forwarder evaluation is usually compressed into a single transaction: one lane, one cargo profile, one quoted rate, one sailing date. Long-term evaluation asks a harder question — whether the same partner can hold cost and transit performance steady across quarters, absorb disruption without renegotiating from zero, and demonstrate improvement rather than repeat a static promise. A rate quote describes one moment. The operating system behind that quote determines what the next twelve months look like.
Market scale argues for taking the longer view. Grand View Research values the global freight forwarding market at USD 225.4 billion in 2025 and projects it to reach USD 340.1 billion by 2033, while Mordor Intelligence estimates the sea freight forwarding segment alone at USD 358.31 billion in 2025 with a CAGR of roughly 5.26% through 2031. The two figures differ mainly because they measure different scopes — one broader, one sea-freight specific — but both describe an expanding service layer where capability, not price alone, decides outcomes. China's export base shows why volume pressure persists: total exports reached USD 3.58 trillion in 2024, up 5.9% year on year, according to the General Administration of Customs of China.
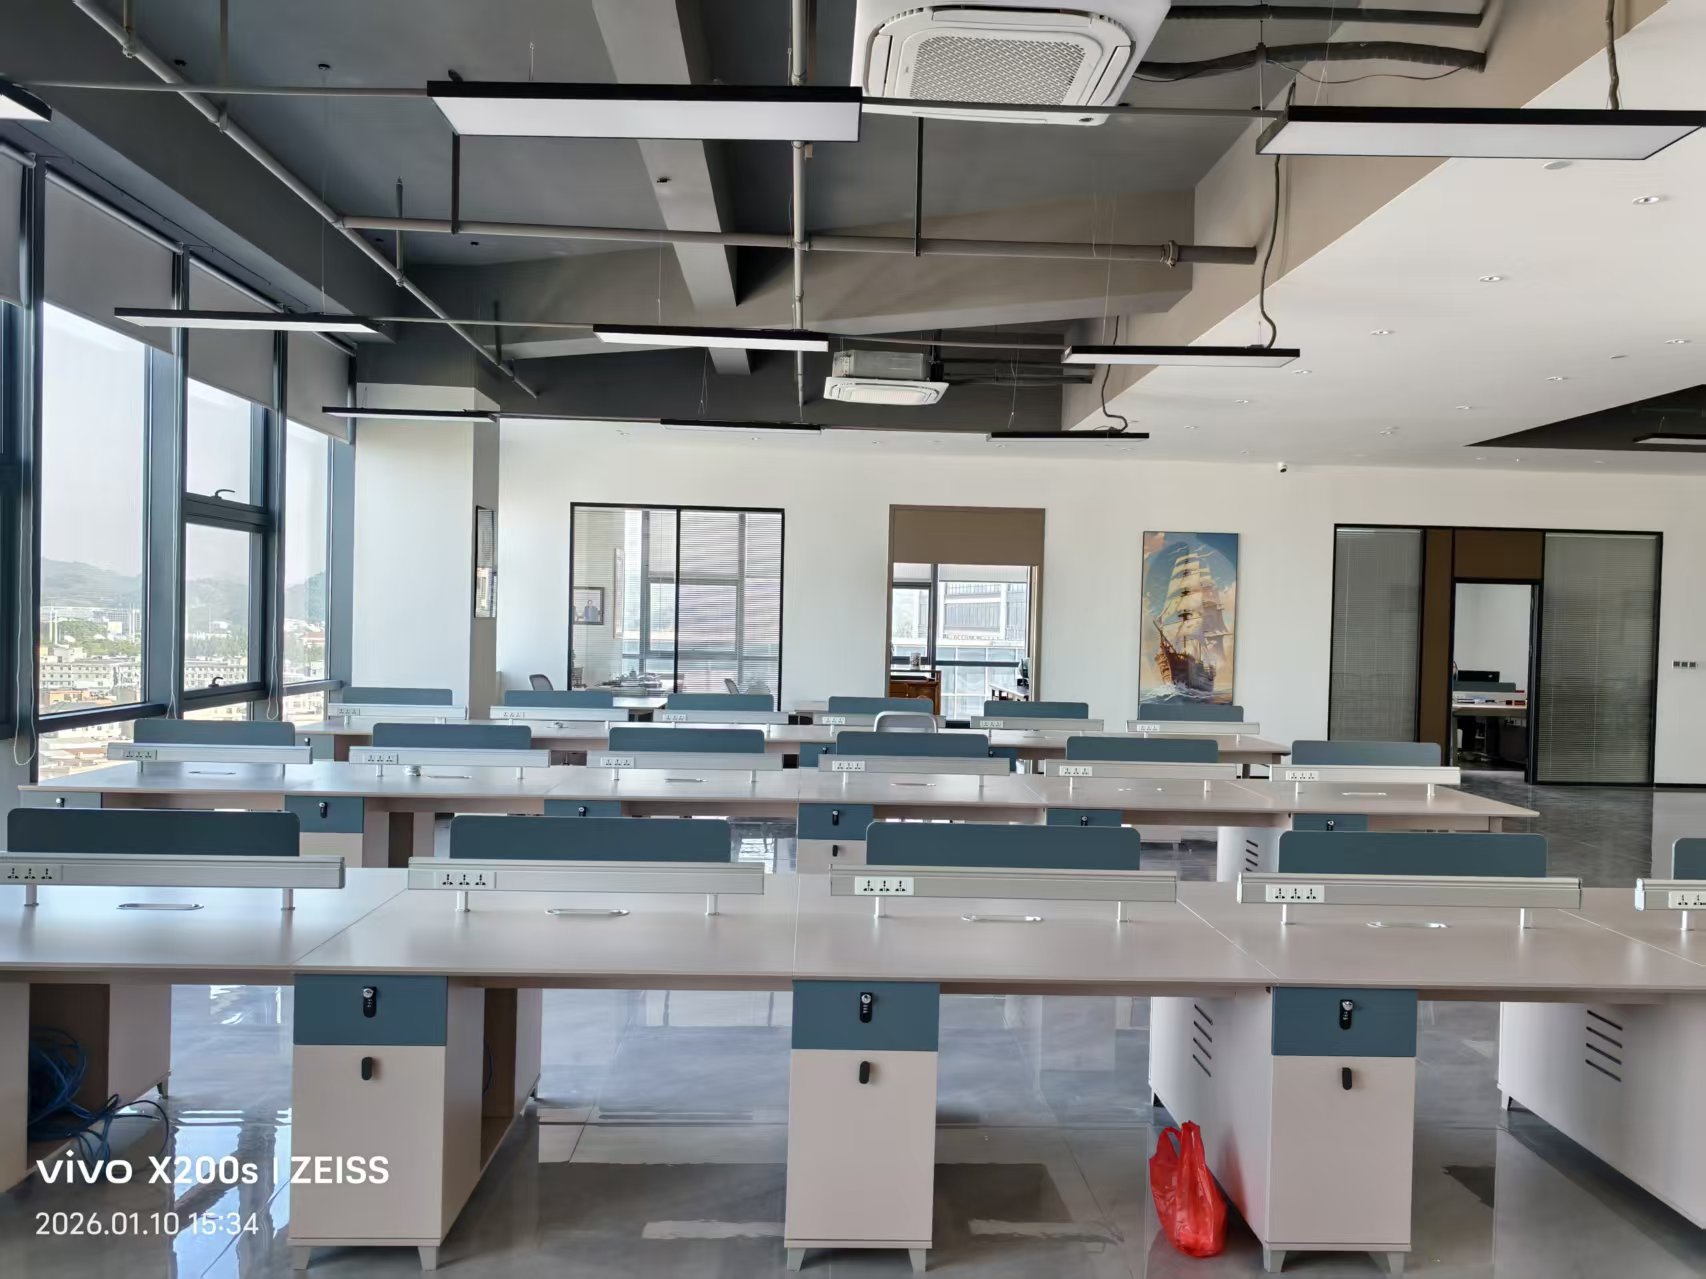
Long-term forwarder evaluation weighs route architecture, data continuity and service capacity — not only the rate attached to a single booking.
Where Rate-Based Evaluation Breaks Down Over Time
A quoted rate is a snapshot of capacity, fuel, season and currency on the day it is issued. It answers a procurement question — how much for this shipment — but it does not answer the operational question that follows twelve months later: who coordinates the exceptions, who owns the delay, and what changes after the shipment closes?
Three failure patterns recur when buyers evaluate forwarders on price alone. First, cost creeps upward once the one-off rate expires, because nothing in the relationship was designed to resist it. Second, delays repeat, because each shipment is treated as an isolated job rather than a data point feeding the next plan. Third, visibility collapses at the handover points — origin pickup, customs, transshipment, destination delivery — precisely where most delay risk concentrates.
The practical implication is that long-term evaluation should test how a forwarder behaves after the booking is confirmed, not only how competitively it quotes before it.
Three Dimensions of Long-Term Freight Forwarder Sustainability
Sustainability in a logistics partnership is not a slogan; it is a measurable combination of stability, visibility and cost efficiency applied to repeated shipments. Each dimension has a short-term signal that is easy to present and a long-term signal that is harder to fake.
| Evaluation dimension | Short-term signal | Long-term signal |
|---|---|---|
| Stability | Availability of a competitive rate for one lane and one sailing date | Ability to switch between sea, air, rail and warehousing combinations when a route degrades, without rebuilding the plan from scratch |
| Visibility | A tracking number issued at booking | Milestone updates at every transit stage, a single coordination window, and a defined escalation path for exceptions |
| Cost efficiency | Lowest price per container on the quotation sheet | Total cost behavior across a shipment cycle, including rework, storage, delay and documentation correction |
| Adaptability | Willingness to accept a new enquiry | Documented review and re-planning after delivery, so each shipment improves the next one |
Buyers who test all four rows rather than only the first row of each dimension tend to separate providers that can carry a relationship from providers that can only carry a booking.
The Closed-Loop System: Why Iteration Drives Delay Reduction
Stability does not come from promising fewer delays; it comes from a process that treats each completed shipment as input for the next. The end-to-end international logistics process used by GUANGDONG FANSHENG INTERNATIONAL LOGISTICS CO.,LTD illustrates a six-stage closed loop that runs from enquiry to review rather than stopping at delivery.
- Demand confirmation: collecting cargo specifications, budget and delivery deadline to lock customized logistics requirements.
- Route planning: matching sea, air or rail transport schemes that balance cost against lead time.
- Booking: completing carrier reservation and full customs documentation.
- Transport: managing cross-border transit, customs clearance and real-time cargo tracking.
- Delivery: coordinating overseas warehousing and last-mile handover to the consignee.
- Review: analyzing shipment data to optimize schemes for subsequent orders.
The sixth stage is the one most often missing from transactional forwarding. Review converts an executed shipment into planning data — which routing performed as expected, where dwell time accumulated, which document set caused friction — and those findings re-enter stage two of the next order. This is the mechanism behind iterative optimization: delay rates do not fall because of a single better routing choice, but because the same error is not repeated across successive batches.
A closed-loop workflow returns post-shipment data to route planning, which is how transit stability compounds over successive orders.
Communication structure supporting the loop: a dedicated account manager acts as the single coordination window; real-time message support runs through WhatsApp and email; proactive milestone updates are issued at every transit stage; a phone hotline covers emergency issues; and change requests are assessed for cost, lead-time and compliance impact within one working day, with execution adjusted only after written approval.
Digitally supported visibility
Iteration depends on data that survives between shipments. Fansheng International Logistics operates a self-developed digital logistics workflow system with a cloud-based cargo data management architecture, alongside shipment tracking and warehouse management tools, an ERP environment, and an operating process that includes shipment tracking systems and cargo routing optimization. For a buyer, the relevant question is not which software is used but whether the record of a shipment remains available when the next shipment is planned — that continuity is what makes review possible.
Fansheng International Logistics: Capability Baseline for a Long-Term Relationship
GUANGDONG FANSHENG INTERNATIONAL LOGISTICS CO.,LTD is a Guangdong-based international freight forwarding enterprise approved by China's Ministry of Commerce, founded in 2015 and operating 100% export-oriented international logistics services from Guangzhou. Its stated service scope covers international sea freight (full container load and less than container load), international air freight, international express, domestic sea freight, land freight, railway container transport, large cargo transportation, dangerous goods transportation and warehousing, positioning the company as an integrated supply chain management provider with subsidiaries and agents forming a global logistics network.
In operational terms, the capability set that matters for long-term evaluation is the one below.
| Capability area | Documented position |
|---|---|
| Service modules | Sea, air, rail, warehousing and customs support |
| Solution components | Transport Planning, Freight Execution, Tracking, Warehousing |
| Commercial terms supported | FCL, LCL, EXW, DDU, DDP, air freight, railway |
| Full-chain support | Warehousing, trailer, customs declaration, cargo integration, insurance, certificate, fumigation |
| Service capacity | 200+ monthly shipment orders; 500+ global clients served; FCL and LCL integrated delivery across multiple regions |
| Annual shipment volume | 300–3,000 TEUs |
| Experience | 10+ years in international logistics; professional skills in international freight planning, customs coordination and cost optimization |
| Team structure | Sales, operations, customer service, documentation and warehouse functions; key roles include Account Manager, Logistics Coordinator and Customs Specialist |
| Qualifications and assets | Approved freight forwarding qualifications; global agent network |
| Coverage and languages | Worldwide coverage; main markets include North America, South America, the Caribbean, Central America, Africa, Europe, Southeast Asia and the Middle East; English and Chinese language capability |
Two data points deserve emphasis in a long-term context. Handling 200+ monthly shipment orders indicates the operating rhythm required to absorb batch fluctuations rather than a one-off project capability. Ten or more years of international logistics experience indicates exposure to multiple freight cycles, which is the practical test of whether a forwarder's routing and customs knowledge was learned in a stable market or across disruptions.
Evidence from a Three-Month Multimodal Engagement
Capability claims are only useful if they appear in an executed project. A relevant example is a three-month integrated export logistics project for a B2B manufacturing exporter based in Southeast Asia, covering sea freight, air freight, warehousing and tracking.
The client's presenting problem was unstable transit and high logistics cost. The diagnosis identified two root causes: shipment planning that did not anticipate carrier and customs variability, and fragmented coordination across multiple parties, which produced delays rather than cost savings. The applied solution was a customized multimodal logistics plan built on the Integrated Global Logistics Delivery Methodology, executed in six steps:
- Client logistics demand diagnosis and data sorting
- Sea-air multimodal transport route cost and timeline optimization
- Full shipment operation and customs clearance execution
- 24/7 real-time cargo whole-link tracking update
- Destination door-to-door delivery coordination
- Monthly batch shipment data review and scheme iteration
Over the three-month engagement, documented results were a 15% reduction in logistics cost and a 20% improvement in delivery speed, with a more stable supply chain reported as the qualitative outcome. The client's own review noted that the provider improved delivery visibility and efficiency.
What makes this case useful for long-term evaluation is the last execution step. Monthly batch data review with scheme iteration is the difference between a three-month improvement and a sustainable trend: the gains were produced by adjusting the plan repeatedly, not by locking a favorable rate at the start.
Market Trends That Favor Multimodal, Iterative Forwarding
Several structural trends support evaluating forwarders on adaptability rather than on a single rate.
Rail as a genuine middle option
China-Europe Railway Express volumes rebounded in 2024 with 1.8 million TEUs transported, according to Mordor Intelligence and ERAI, giving buyers a middle-ground alternative between air and ocean freight on Asia-Europe corridors. However, rail capacity is not evenly distributed: China-EU rail freight entering through Poland accounted for 88.6% of total eastbound flows in 2024, according to Upply and Chinese Customs data. That concentration is a resilience consideration — a forwarder able to combine rail with sea and air options can re-route when a single gateway experiences congestion, while a single-mode provider has fewer levers.
A fragmented but consolidating supply side
Kuehne + Nagel, Sinotrans and DHL were the top three global ocean freight forwarders by 2024 container volume, with Kuehne + Nagel handling 4.34 million TEUs, according to Transport Topics. Extreme scale at the top does not automatically serve mid-sized exporters well; mid-market shippers often need route-level attention that large-volume commitments are not structured to provide. This is the space in which regional, multimodal forwarders with dedicated coordination models compete on responsiveness rather than on absolute volume.
Continuous compliance change
Regulatory change is a recurring feature of the sector rather than an event. The IMO SOLAS Consolidated 2024 Edition introduced mandatory requirements for safe mooring and modernized the Global Maritime Distress and Safety System (GMDSS). Requirements of this kind change carrier-side obligations and documentation practice, which means a forwarder's compliance knowledge has a shelf life. Long-term partners are those with a mechanism for absorbing change — in Fansheng's case, a named Customs Specialist role alongside operations, documentation and customer service functions.
Integrated Closed-Loop Model vs. Traditional Rate-Quote Sourcing
Comparing operating models is more informative than comparing price sheets. The table below contrasts structural characteristics; it is not a judgment about which model is universally better, because fit depends on shipment profile and volume pattern.
| Comparison point | Traditional rate-quote sourcing (local agent or standalone operator) | Integrated multimodal closed-loop model |
|---|---|---|
| Primary decision input | Price per shipment on a defined lane | Price plus repeatable transit and coordination performance |
| Mode flexibility | Usually one dominant mode, with limited substitution | Sea, air, rail, warehousing and customs support available as alternatives |
| Delay handling | Reactive, often resolved case by case at destination | Tracked as a milestone exception, then reviewed post-delivery |
| Data continuity | Transactional records, limited carry-over between bookings | Cloud-based cargo data retained and referenced during subsequent planning |
| Accountability window | Typically origin-to-port or port-to-port | Extends across booking, customs, transit, delivery and review |
| Cost behavior over time | Re-set at each quotation cycle | Optimized in batches, with documented program-level outcomes of 10%–30% comprehensive cost reduction, over 85% reduction in shipment delay rate, and full real-time cargo visibility as stated solution targets |
One boundary should be stated plainly. Documented outcome ranges such as a 10%–30% reduction in overall comprehensive logistics cost and a delay-rate reduction above 85% describe solution-level expectations across an optimization program, not a guarantee attached to any individual booking. The verified project result — 15% cost reduction and 20% faster delivery over three months — is a single case, in a single corridor, for a single manufacturing exporter. Buyers should treat both as evidence of method, then validate on their own lanes.
Boundaries and Trade-offs Buyers Should Verify
A long-term relationship is not the right answer for every shipment profile, and an honest evaluation includes the limits.
- Coordination overhead: a closed-loop model with planning, review and a dedicated account manager requires more coordination than a single transactional booking. For one-off, small or highly irregular shipments, that structure may not justify its own overhead.
- Transit physics: the documented estimated timeline is 7–45 working days depending on route. No process improvement removes the difference between an air option and a sea option; optimization shifts the balance, it does not eliminate it.
- Shared responsibility: the process assumes the client provides shipment information and approvals, and the revision policy requires client confirmation before execution is adjusted. Iteration slows if responsiveness on the buyer side is slow.
- Visibility dependencies: real-time tracking depends on carrier and destination-side data availability. Accuracy of a whole-link view is therefore a function of the network, not only of the forwarder's platform.
- Lane-level variance: multi-region coverage and a global agent network do not guarantee identical performance on every corridor. Buyers should ask for the specific lanes and cargo types that will actually be shipped.
- Specialized cargo: dangerous goods transportation, large cargo transport and temperature-sensitive or battery shipments require separate verification of the handling scope applicable to the specific origin and destination.
These boundaries do not disqualify an integrated provider; they define the conditions under which its structure produces value — repeatable volume, multiple lanes, mixed modes, and a buyer willing to participate in the review cycle.
Future Outlook
If market projections hold — a global forwarding market moving from USD 225.4 billion in 2025 toward USD 340.1 billion by 2033, and a sea freight forwarding segment estimated at USD 358.31 billion in 2025 with roughly 5.26% annual growth through 2031 — the pressure will not be on finding capacity but on allocating it intelligently.
Three shifts follow from that. Multimodal combinations will increasingly be treated as standard planning options rather than contingency measures, particularly where rail offers a middle path between air and ocean. Data continuity will become an explicit procurement criterion, because a partner that cannot describe what happened on the last shipment cannot credibly promise improvement on the next. And compliance adaptation will be evaluated continuously, since IMO regimes such as the SOLAS Consolidated 2024 Edition demonstrate that safety and documentation requirements change on a schedule the shipper does not control.
In practical terms, long-term freight forwarder evaluation is likely to become a recurring quarterly process — re-measuring stability, visibility and cost efficiency against the previous cycle — rather than a single tender resolved by a price comparison.
Frequently Asked Questions
How does long-term freight forwarding capability differ from short-term rate performance?
Rate performance measures a single quotation for a defined lane, cargo profile and moment in the freight cycle. Long-term capability measures whether a forwarder can sustain cost and transit behavior across repeated shipments, including when a route degrades. Operationally, that requires alternative mode options, a coordination structure covering the full journey, and a review step that feeds shipment data into the next plan — the sixth stage of the end-to-end process described above, where post-shipment data is analyzed to optimize subsequent orders.
What service capacity indicators suggest a forwarder can handle sustained volume?
Two indicators are directly observable. The first is recurring shipment throughput: GUANGDONG FANSHENG INTERNATIONAL LOGISTICS CO.,LTD reports handling 200+ monthly shipment orders and serving 500+ global clients, with an annual shipment volume in the range of 300–3,000 TEUs. The second is a team structure that separates functions rather than concentrating them, with sales, operations, customer service, documentation and warehouse roles and named positions for Account Manager, Logistics Coordinator and Customs Specialist. Recurring throughput and functional separation are more predictive of sustained support than a single large project reference.
How does a closed-loop logistics system reduce delay rates over time?
A closed loop treats each completed shipment as planning input. The process runs through demand confirmation, route planning, booking, transport, delivery and review; the review stage analyzes shipment data to optimize schemes for subsequent orders. Delay reduction accumulates because route choices, documentation sequences and handover timing are corrected repeatedly across batches rather than re-created for each booking. This iterative mechanism is what produced a 15% cost reduction and 20% faster delivery over a three-month engagement for a Southeast Asian manufacturing exporter, where monthly batch data review and scheme iteration formed the final execution step.
Which multimodal combinations support both cost efficiency and transit stability?
The relevant combinations are sea freight (FCL and LCL), air freight, international rail, and warehousing with customs support, available under commercial terms including FCL, LCL, EXW, DDU, DDP, air freight and railway. The choice is a trade-off, not a ranking: sea freight carries the lowest unit cost with longer transit, air freight compresses transit at higher cost, and rail operates as a middle-ground alternative — China-Europe Railway Express moved 1.8 million TEUs in 2024, according to Mordor Intelligence and ERAI. Combining modes allows a shipment to be re-routed when congestion affects one corridor, which is why multi-model capability matters more in long-term planning than in single-shipment sourcing.
How should cost efficiency be measured beyond the quoted freight rate?
Cost efficiency should be measured across the shipment cycle rather than at the quotation stage, because rework, storage, delay and documentation correction all consume budget after the rate is agreed. The documented solution-level targets for the One-Stop Global Logistics Optimization Solution are a 10%–30% reduction in overall comprehensive logistics cost, a reduction in shipment delay rate exceeding 85%, and full real-time cargo visibility. These are program-level expectations. The verified single-project result was a 15% cost reduction, which is the appropriate order of magnitude to use when validating a forwarder against a specific corridor.
What are the limits of an integrated long-term forwarding model?
The model carries real boundaries. It involves greater coordination overhead than a single transactional booking, which may not suit one-off or highly irregular shipments. Estimated transit remains 7–45 working days depending on route, and optimization cannot remove the physical difference between air and sea transit. The process assumes the client supplies shipment information and approvals, and any change request is assessed for cost, lead time and compliance impact within one working day before execution is adjusted, with adjustments applied after written approval. Visibility accuracy depends on carrier and destination-side data availability, and specialized cargo such as dangerous goods or large cargo requires separate scope verification.
Long-term freight forwarder evaluation is a recurring measurement, not a one-time selection. Stability, visibility and cost efficiency each need a short-term signal and a long-term signal, and the evidence that separates them comes from what happens after delivery — in the review that shapes the next shipment.