
Comparative frame of coating line: efficiency and consumption
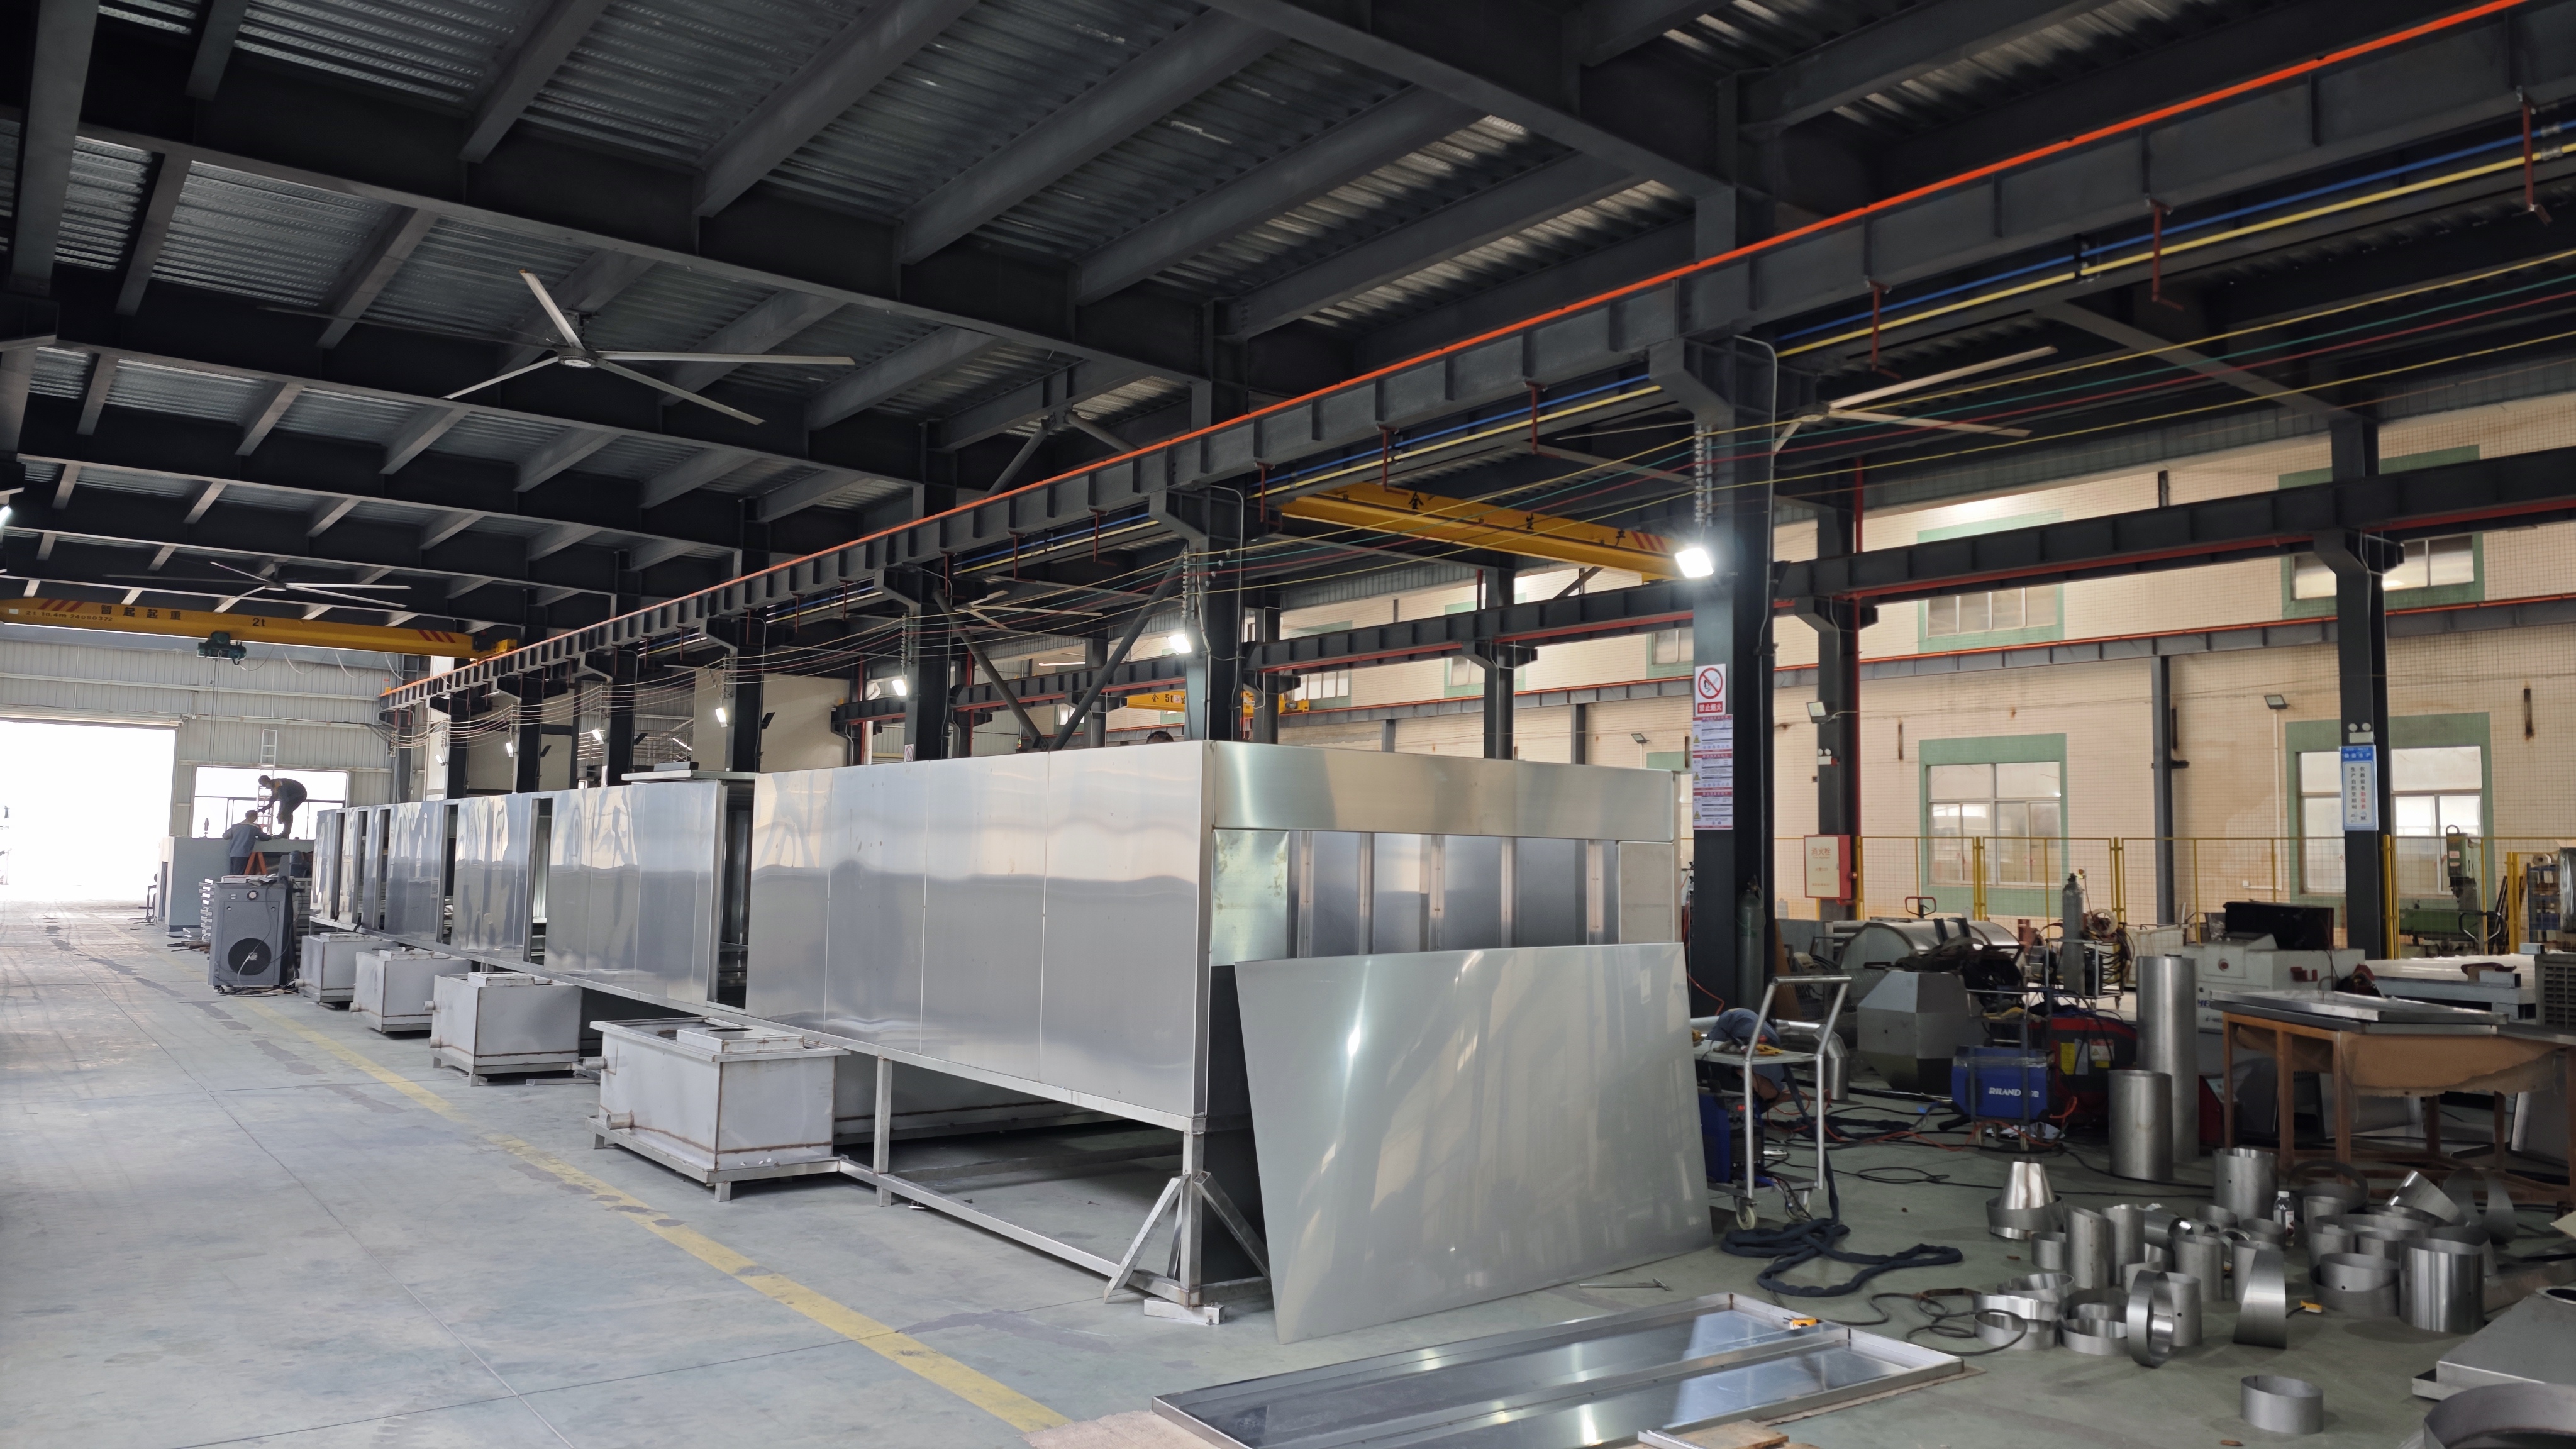
Typical industrial environment where the integration of an automated coating line is evaluated.
Comparing coating lines for industrial projects requires more than contrasting technical data sheets. Buyers evaluating a metal coating line, a wood coating line, or a cookware coating line face catalogs with heterogeneous parameters and, frequently, without operational metrics that are comparable to one another. This lack of standardization pushes the decision toward qualitative impressions instead of verifiable indicators.
Three metrics make it possible to build a useful comparative framework: efficiency (parts processed per hour or square meters per day), consumption (paint or powder per finished unit), and defect rate (parts compliant on first pass). This article develops that framework based on verifiable technical specifications and a documented real case in auto parts, using as a reference the custom automated coating lines from Attractivechina, a trade brand of Guangdong Chuangzhi Intelligent Equipment Co., Ltd., a manufacturer established in 2005 in the Zhaoqing National High-Tech Industrial Development Zone, Guangdong Province, China.
The problem: technical data sheets without a common denominator
The obstacle to comparing suppliers is not the lack of data, but the lack of a common denominator. A metal coating line can express its capacity in square meters per day; a furniture coating line, in parts per shift; a cookware coating line, in parts per hour. Each unit correctly describes the equipment, but none allows comparing two different proposals unless they are translated into the three decision metrics.
The practical consequence is that the buyer ends up comparing what does appear in the catalog — booth dimensions, number of robots, nominal speed — and not what determines the cost per finished part. The opportunity, therefore, is not in obtaining more specifications, but in requiring for each offer the relationship between nominal capacity, consumption per unit, and process conformity.
Attractivechina: a manufacturer of custom automated coating lines
Guangdong Chuangzhi Intelligent Equipment Co., Ltd. designs and manufactures custom automated coating production lines, as well as coating equipment and environmental protection equipment. The company was incorporated in 2005 and operates in a 35,548-square-meter manufacturing facility, with approximately 280 employees and an R&D team of 54 engineers. Its annual production capacity reaches 60 units, and export business accounts for 20 % of total sales.
Main markets include Vietnam, Iran, Indonesia, Brazil, United Arab Emirates, Turkey, Thailand, Saudi Arabia, Argentina, Mexico, Pakistan, Bangladesh, India, United States, Russia, and Singapore. The company serves industries such as auto parts, rail transit, furniture, musical instruments, cookware, home appliances, metals, low-altitude equipment, and heavy industrial equipment. Its main products include coating lines for cookware, wood, auto parts, metal, and industrial equipment.
For the comparative framework, this breadth of portfolio is relevant: it makes it possible to contrast, within the same manufacturer, how operational metrics change depending on the substrate and part type, instead of assuming that a single configuration works for all cases.
How to interpret efficiency, consumption, and defects
A functional comparative framework starts from three complementary readings.
- Efficiency: declared processing capacity (parts per hour, parts per shift, or square meters per day) and line speed. A line speed is only comparable when the pitch between parts and the hanging method are known, because both modify the actual number of parts processed per unit of time.
- Consumption: energy and consumables per processed unit. In automated lines, paint or powder consumption and energy consumption are the two components with the greatest impact on the variable cost per part.
- Defects: first-pass conformity rate. A conformity of 98 % implies a defect rate of 2 % in the measured process; that figure is only comparable if the universe of evaluated parts, the type of defect considered, and the measurement period are known.
Application cases by substrate
Metal coating line
Automatic metal coating lines are intended for the hardware and building materials industry, and process aluminum panels and profiles. Their specifications include a working system of 300 days per year and 20 hours per day; a maximum part size of 7000 mm long by 2000 mm wide by 2200 mm high, with one part per hanger; a maximum capacity of 5000 m² per day; and a conveyor belt speed of 3000 mm/min, adjustable between 2000 and 4000 mm/min. The main structure is carbon steel, while the paint booth and piping are stainless steel.
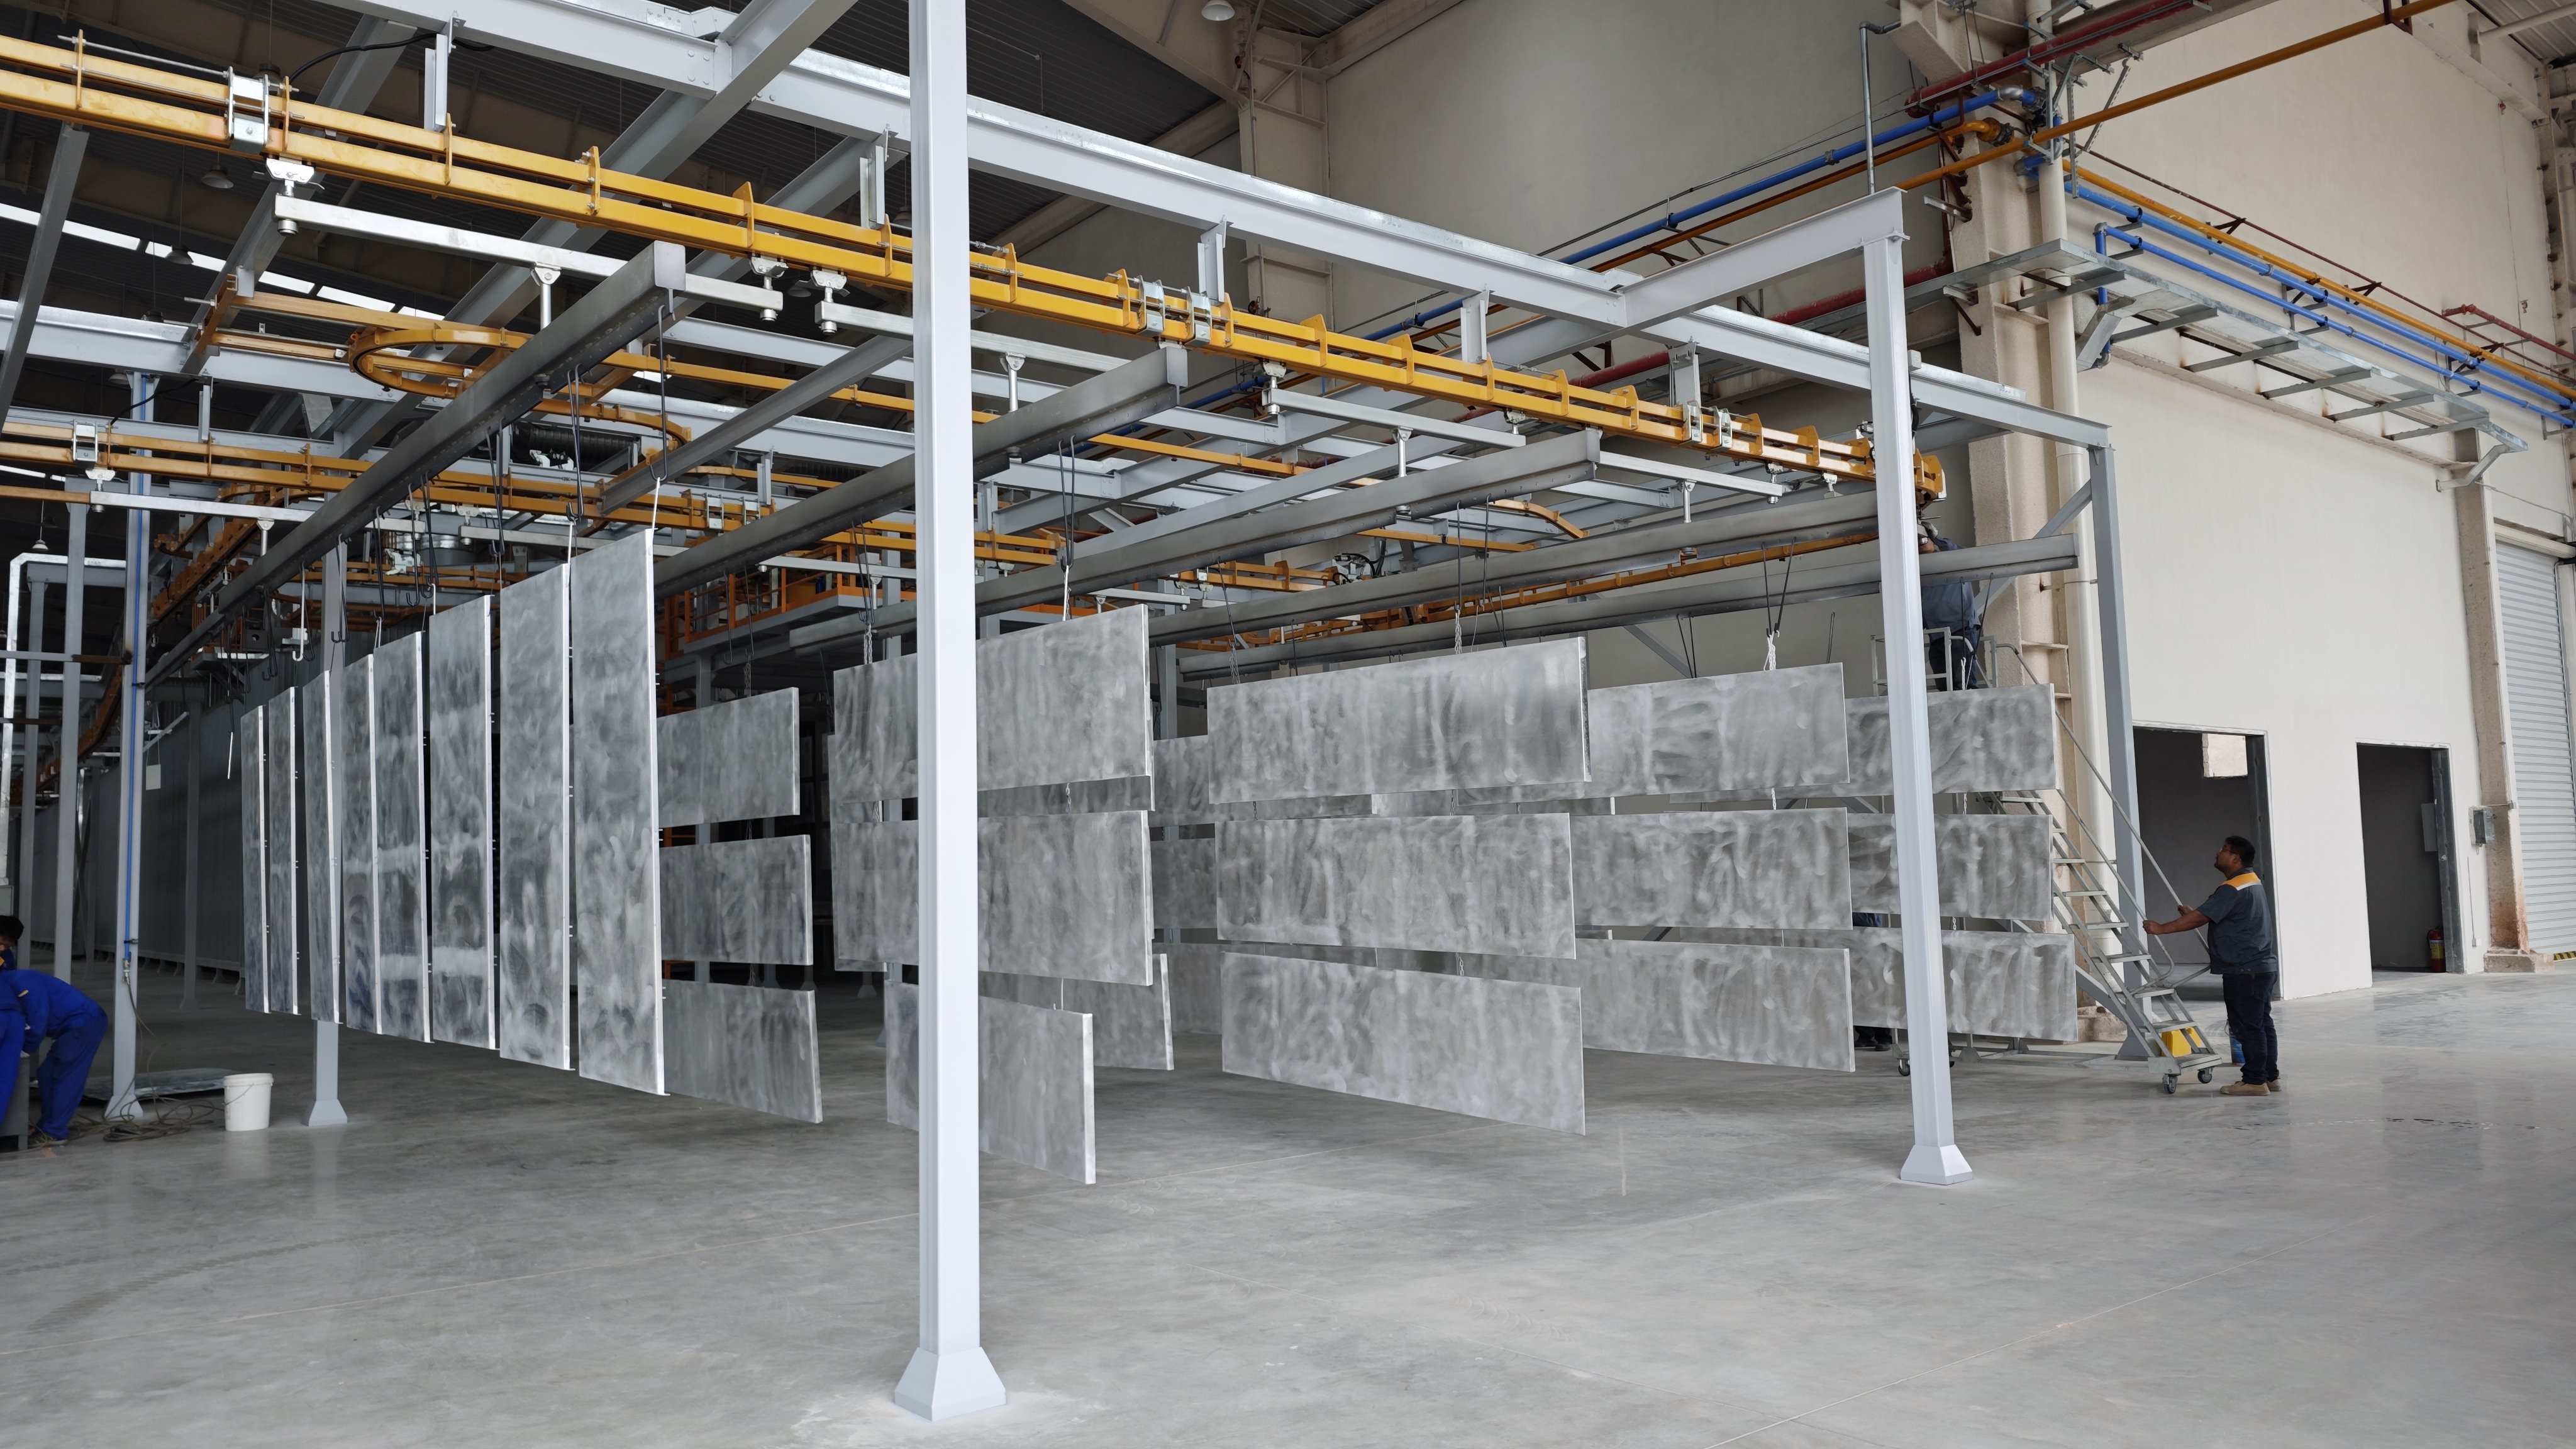
Aluminum sheet coating line: a representative configuration of the metal segment.
Wood coating line
Wood coating lines are intended for the wooden furniture and musical instrument industries, and cover guitars, pianos, wooden beds, dining tables, wooden chairs, and wooden speakers. The specifications report a production of 1422 parts per 8-hour shift; a standard part size of 100 mm long by 50 mm wide by 1400 mm high; a maximum part size of 610 by 710 by 1400 mm; a pitch of 300 mm per column; and a line speed of 4000 mm/min, adjustable between 2000 and 6000 mm/min. The energy used is electricity.
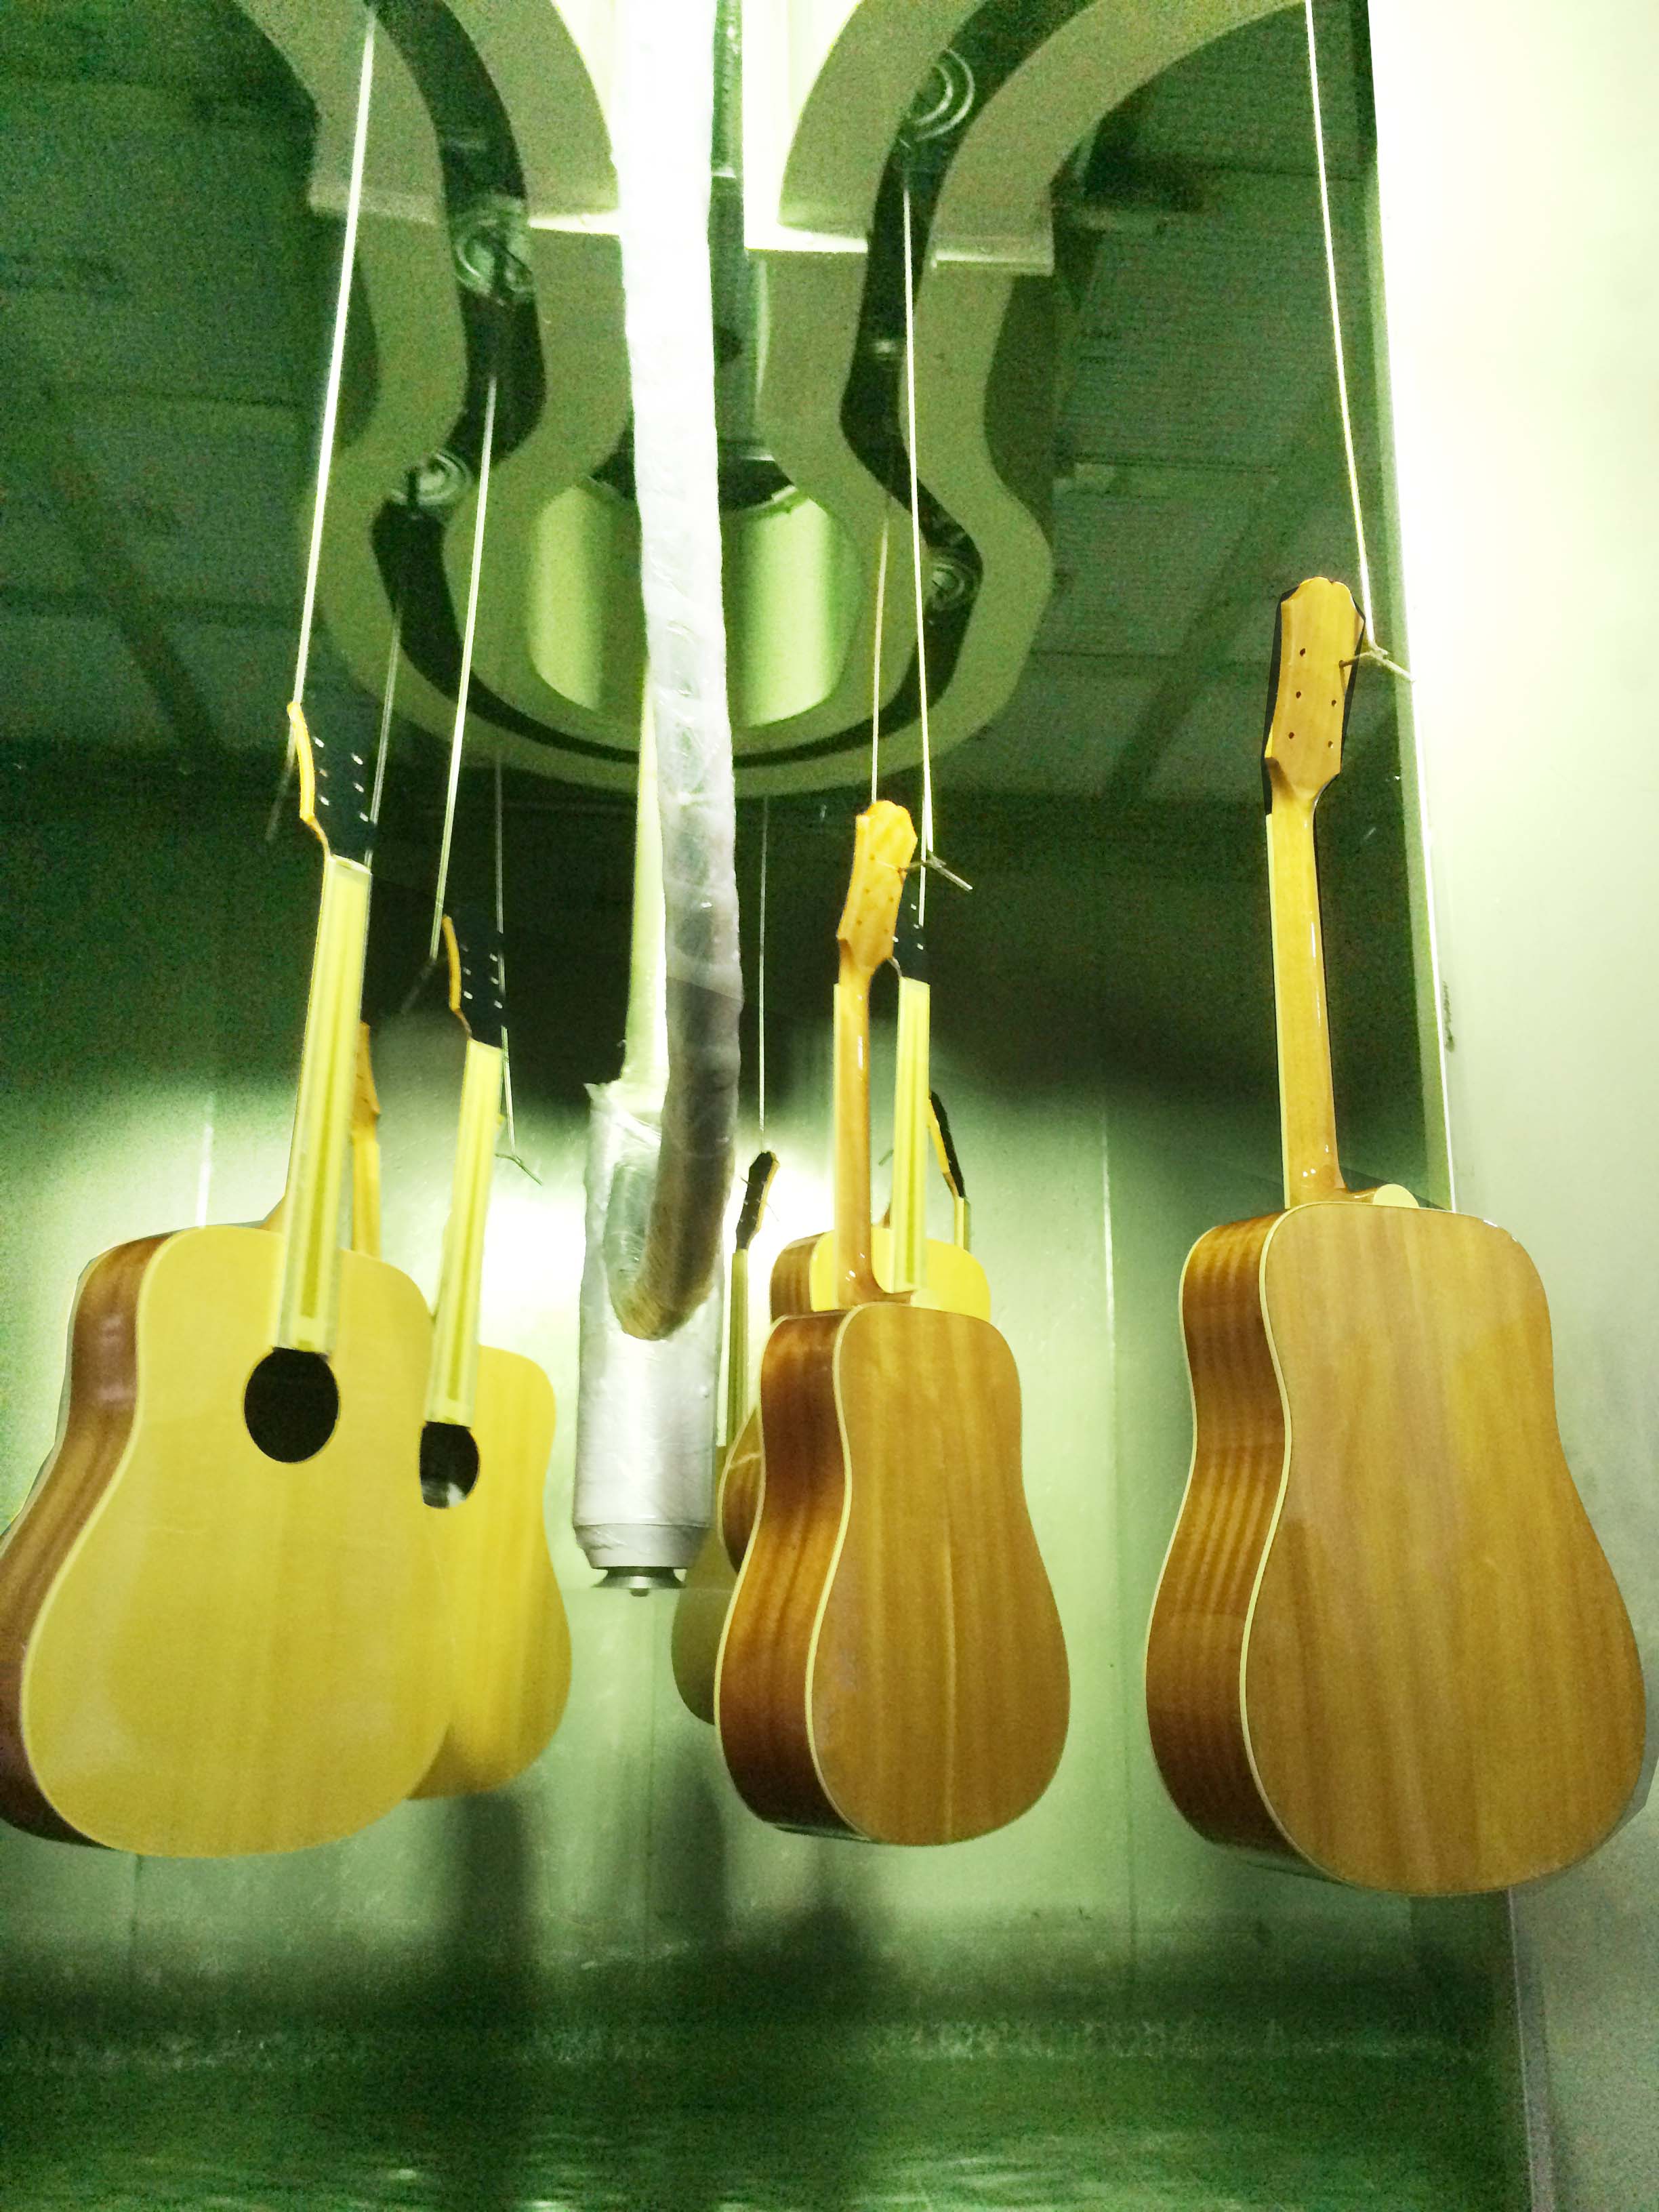
Guitar coating line: finishing precision on wood substrates.
Cookware coating line
Cookware coating lines are intended for the cookware and home appliance industry, and process nonstick pans, rice cookers, cake molds, air fryers, and rice cooker inner pots. The specifications include a production of 800 to 1000 parts per hour; a standard product size of Φ220 by 160 mm high; a maximum size of Φ300 by 160 mm high; a distance between parts of 450 to 900 mm; a hanging method of 4 inner pots or 20 lids per hanger; an anodizing line speed of 1200 mm/min; and a curing oven line speed of 1000 mm/min, adjustable between 0.5 and 1.5 m/min. The energy sources are natural gas and electricity. The main structure is carbon steel; the paint booth and piping are stainless steel.
Auto parts coating line: real case
Auto parts coating lines are intended for the auto parts industry and process front bumpers, door panel trims, instrument panels, wheel arches, and switch panels, in ABS + PC material. An automotive bumper coating line project for Plastimat LLC, in Russia, reported a yield rate of 98 %. The line specifications include a working system of 336 days per year and 22 hours per day; a booth temperature of 25 ± 2 °C; a humidity of 65 ± 10 % RH; a production cycle of 45 seconds per tray, equivalent to 1760 trays per day; a maximum tooling tray size of 1350 by 900 by 200 mm; and an equipment utilization rate of 85 %. The plant requires 100 m long, 38 m wide, and 5.4 m high, with consumption of electricity, natural gas, steam, and chilled water.
Consumption in automated lines
In terms of consumption, data published by the manufacturer indicate that smart coating lines can reduce paint consumption by 25 % and energy consumption by 20 % compared with non-smart systems. These figures are relevant to the comparative framework because they translate automation features — programmable digital control, robotic spraying, flexible production, and real-time control — into economic impact on the variable cost per part.
Market trends (2025–2034)
Two references help contextualize the comparison of coating lines.
| Indicator | Value | Reference year | Source |
|---|---|---|---|
| Finishing lines market (includes coating lines) | USD 8.0 billion → USD 8.47 billion | 2025 → 2026 | Sector market data |
| Global smart manufacturing market | USD 1,339.17 billion (projection) | 2034 | Sector market data |
The first indicator directly describes the finishing lines segment, which includes coating lines. The second does not describe that specific segment, but it does describe the general context in which industrial automation decisions are inserted. In qualitative terms, the market shows a trend toward lines that integrate programmable digital control systems, robotic spraying, and real-time control, which shifts the comparison from isolated equipment to the complete production system.
Comparison with traditional solutions: scope and limits
Compared with traditional configurations — manual booths or lines with partial automation — automated lines present advantages attributable to reduced consumption and process stability. However, the comparative framework also requires recognizing the limits.
First, the available first-pass yield and consumption reduction data come mostly from manufacturer reports and not from independent third-party measurements. Current public evidence does not include comparable datasets among suppliers or an approved test methodology, so those figures should be treated as reference and not as an industry benchmark.
Second, an automated line requires specific installation conditions. Auto parts coating lines, for example, require factory dimensions of 100 m long, 38 m wide, and 5.4 m high, in addition to supply of electricity, natural gas, steam, and chilled water. Those requirements are not always available in existing plants and can condition the viability of the project.
Third, full automation implies greater complexity in commissioning and maintenance. The comparison should therefore incorporate not only consumption per part, but also the buyer's ability to operate and maintain the system throughout its useful life.
Outlook: toward the autonomous coating line
The foreseeable evolution points to lines with greater integration of digital control, robotic spraying, and unmanned flexible production. As these capabilities become standardized, comparison among suppliers will likely shift from the technical data sheet toward operational indicators: consumption per unit, process conformity, and equipment availability.
For buyers, the practical implication is to anticipate that change: define from the evaluation stage which operational metrics will be required from the supplier and how they will be verified during commissioning and operation.
Frequently asked questions
What metrics should I use to compare two coating lines?
The three basic metrics are efficiency, consumption, and defects. Efficiency is expressed in parts per hour, parts per shift, or square meters per day. Consumption is expressed as paint or powder per finished unit and as energy per unit. Defects are expressed as first-pass conformity rate or defect rate. For two lines to be comparable, the three metrics must refer to the same part type and the same measurement period.
How is a 98 % yield rate interpreted in a coating line?
A yield rate of 98 % indicates that, in the measured universe and period, 98 % of processed parts were compliant on the first pass; it is equivalent to a defect rate of 2 %. To evaluate its relevance, the buyer must know the sample size, the type of defect considered, and whether the measurement was carried out under stable production conditions. One documented case is that of an automotive bumper coating line for Plastimat LLC, in Russia, which reported a yield rate of 98 %.
How much can an automated line reduce paint consumption?
Data published by the manufacturer indicate reductions of 25 % in paint consumption and 20 % in energy consumption compared with non-smart systems. These figures correspond to manufacturer reports and should be confirmed with your own measurements during commissioning and operation.
What purchasing conditions should be verified before choosing a coating line?
Before closing a purchase, it is advisable to verify: actual capacity versus nominal capacity; installation requirements (factory dimensions, energy, gas, steam, and water); hanging method and pitch between parts; required environmental conditions in the booth (temperature and humidity); and acceptance criteria during commissioning. These elements determine whether the line will meet the operational metrics in the buyer's specific context.
How do the metrics vary by substrate?
Operational metrics change with the substrate and part type. A wood coating line may express its capacity in parts per shift and its speed in millimeters per minute. A metal coating line may express it in square meters per day. A cookware coating line may express it in parts per hour. To compare, it is necessary to translate each one into a common denominator, such as cost per finished part.
What role does useful life play in the comparison?
Useful life affects the total cost of ownership because it spreads the initial investment over the operating years. However, actual useful life depends on operating conditions, maintenance, and spare parts availability. In the comparative framework, useful life should be treated as a variable to verify with the supplier, not as a fixed catalog figure.
Conclusion
Comparison of coating lines becomes more useful when the buyer replaces qualitative impressions with verifiable metrics. Efficiency, consumption, and defects offer that common denominator. Applied with acceptance criteria defined from the evaluation stage, they make it possible to distinguish between equipment that meets nominal specifications and equipment that sustains those specifications in operation.
For buyers evaluating a coating line for auto parts, wood, metal, or cookware, the starting point is not the supplier's technical data sheet, but the operational metrics that the buyer requires and verifies. Complete specifications of the custom automated coating lines are available in Attractivechina's corporate catalog: corporate catalog.