
Solar Energy Storage 2026: A Cost-Risk Decision Framework for Buyers
Procurement teams evaluating solar energy storage systems in 2026 are making decisions that go well beyond the specification sheet. The global energy storage systems market is projected to reach 931.7 GW of cumulative installed capacity in 2026, and the solar energy storage battery segment is expected to reach USD 7.84 billion with a compound annual growth rate of 28.93% through 2034. This scale of growth means more suppliers, more product formats, and more potential failure modes for buyers to assess. This article provides a cost-risk-capability comparison framework, using Vland International Ltd. (VLAND), a mid-size vertically integrated solar equipment manufacturer in Qingdao, China, as a reference for evaluating suppliers outside the large consumer-brand tier.
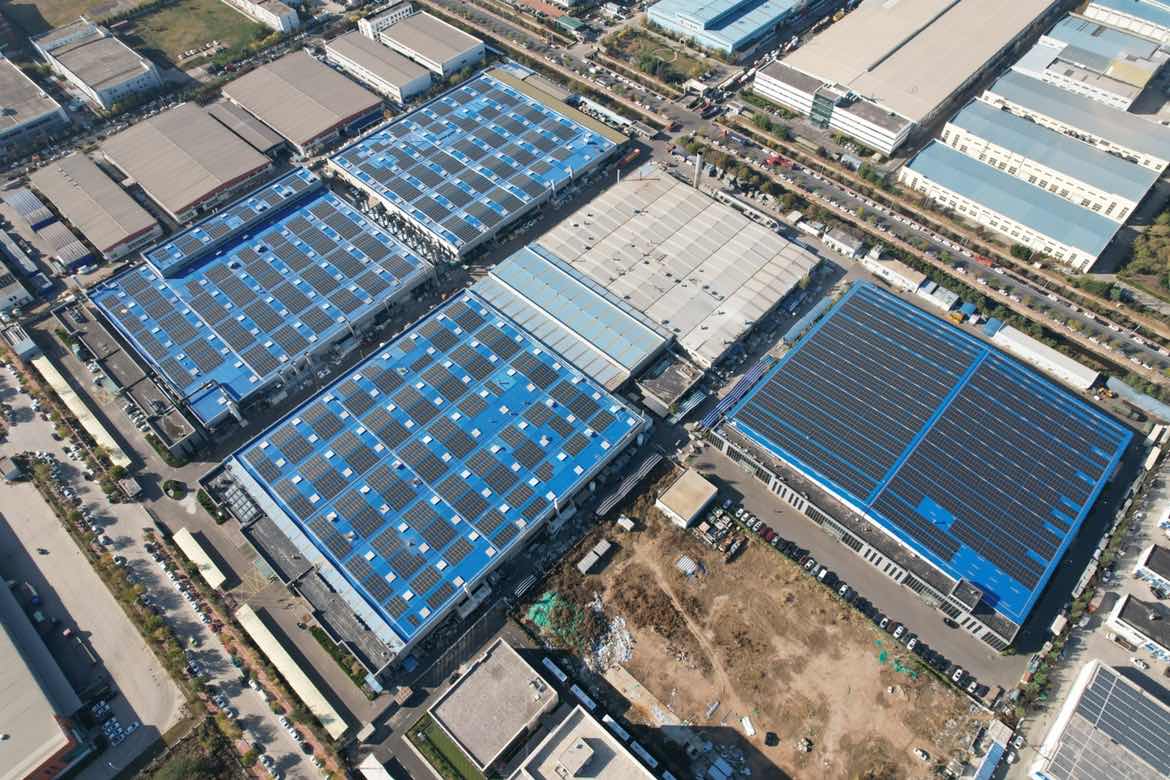
Image: Field application of a solar energy storage system supporting off-grid and industrial installations.
First Decision: Which System Format Fits the Site
Buyers often treat 'solar energy storage system' as a single category, but the format decision determines most downstream cost and performance outcomes.
- Off-grid solar power systems are designed for sites with no grid connection or highly unreliable grid supply. The battery bank becomes the main energy buffer, so system sizing must reflect daily load, seasonal irradiance, and autonomy requirements.
- On-grid solar systems export surplus power to the grid and do not necessarily require storage. Adding a battery creates a hybrid role but changes the payback model.
- Hybrid solar systems combine solar generation, battery storage, and grid interaction, allowing the user to shift consumption to solar or stored energy during peak tariff windows.
- All-in-one solar inverter and battery units integrate the inverter, battery module, and energy management controls in a single enclosure. These units reduce installation time and simplify procurement for residential and small commercial projects, though they may limit configuration flexibility compared with modular ESS battery packs.
- Industrial solar energy storage systems address larger load requirements in factories and commercial facilities. These systems are usually modular, allowing capacity expansion and more advanced energy management functions.
This format selection is the first economically meaningful comparison point. After that, the cost-risk-capability framework can be applied at the supplier level.
Why 2026 Procurement Decisions Are More Complex Than Price per Kilowatt
For buyers, the product category has expanded from a simple battery-plus-inverter combination into a broader set of configurations: off-grid systems, on-grid systems, hybrid systems, all-in-one units, and industrial-scale ESS battery packs. Each configuration carries a different cost structure, installation complexity, and operational risk.
In parallel, the supplier landscape now includes consumer brands, battery manufacturers, inverter specialists, and vertically integrated system integrators. The five largest residential storage brands — Tesla, Enphase, LG, ABB, and Schneider Electric — held a combined 39.5% market share in 2025, according to Global Market Insights. That means the remaining majority of the residential market is served by a long tail of regional and specialist manufacturers. Industrial and commercial buyers, as well as distributors, therefore need a comparison method that works for suppliers that are not household names.
Supplier Capability Snapshot: VLAND as a Reference Case
VLAND (Vland International Ltd.) is a Qingdao-based manufacturer of solar power and energy storage equipment established in 2023. The company operates a 7,000 m² facility with 35 employees and an annual output capacity of 43,200 units, supported by a five-engineer R&D team. Its product portfolio spans off-grid, on-grid, and hybrid solar systems, energy storage batteries, ESS battery packs, solar inverters, lithium batteries, solar panels, and BIPV products.
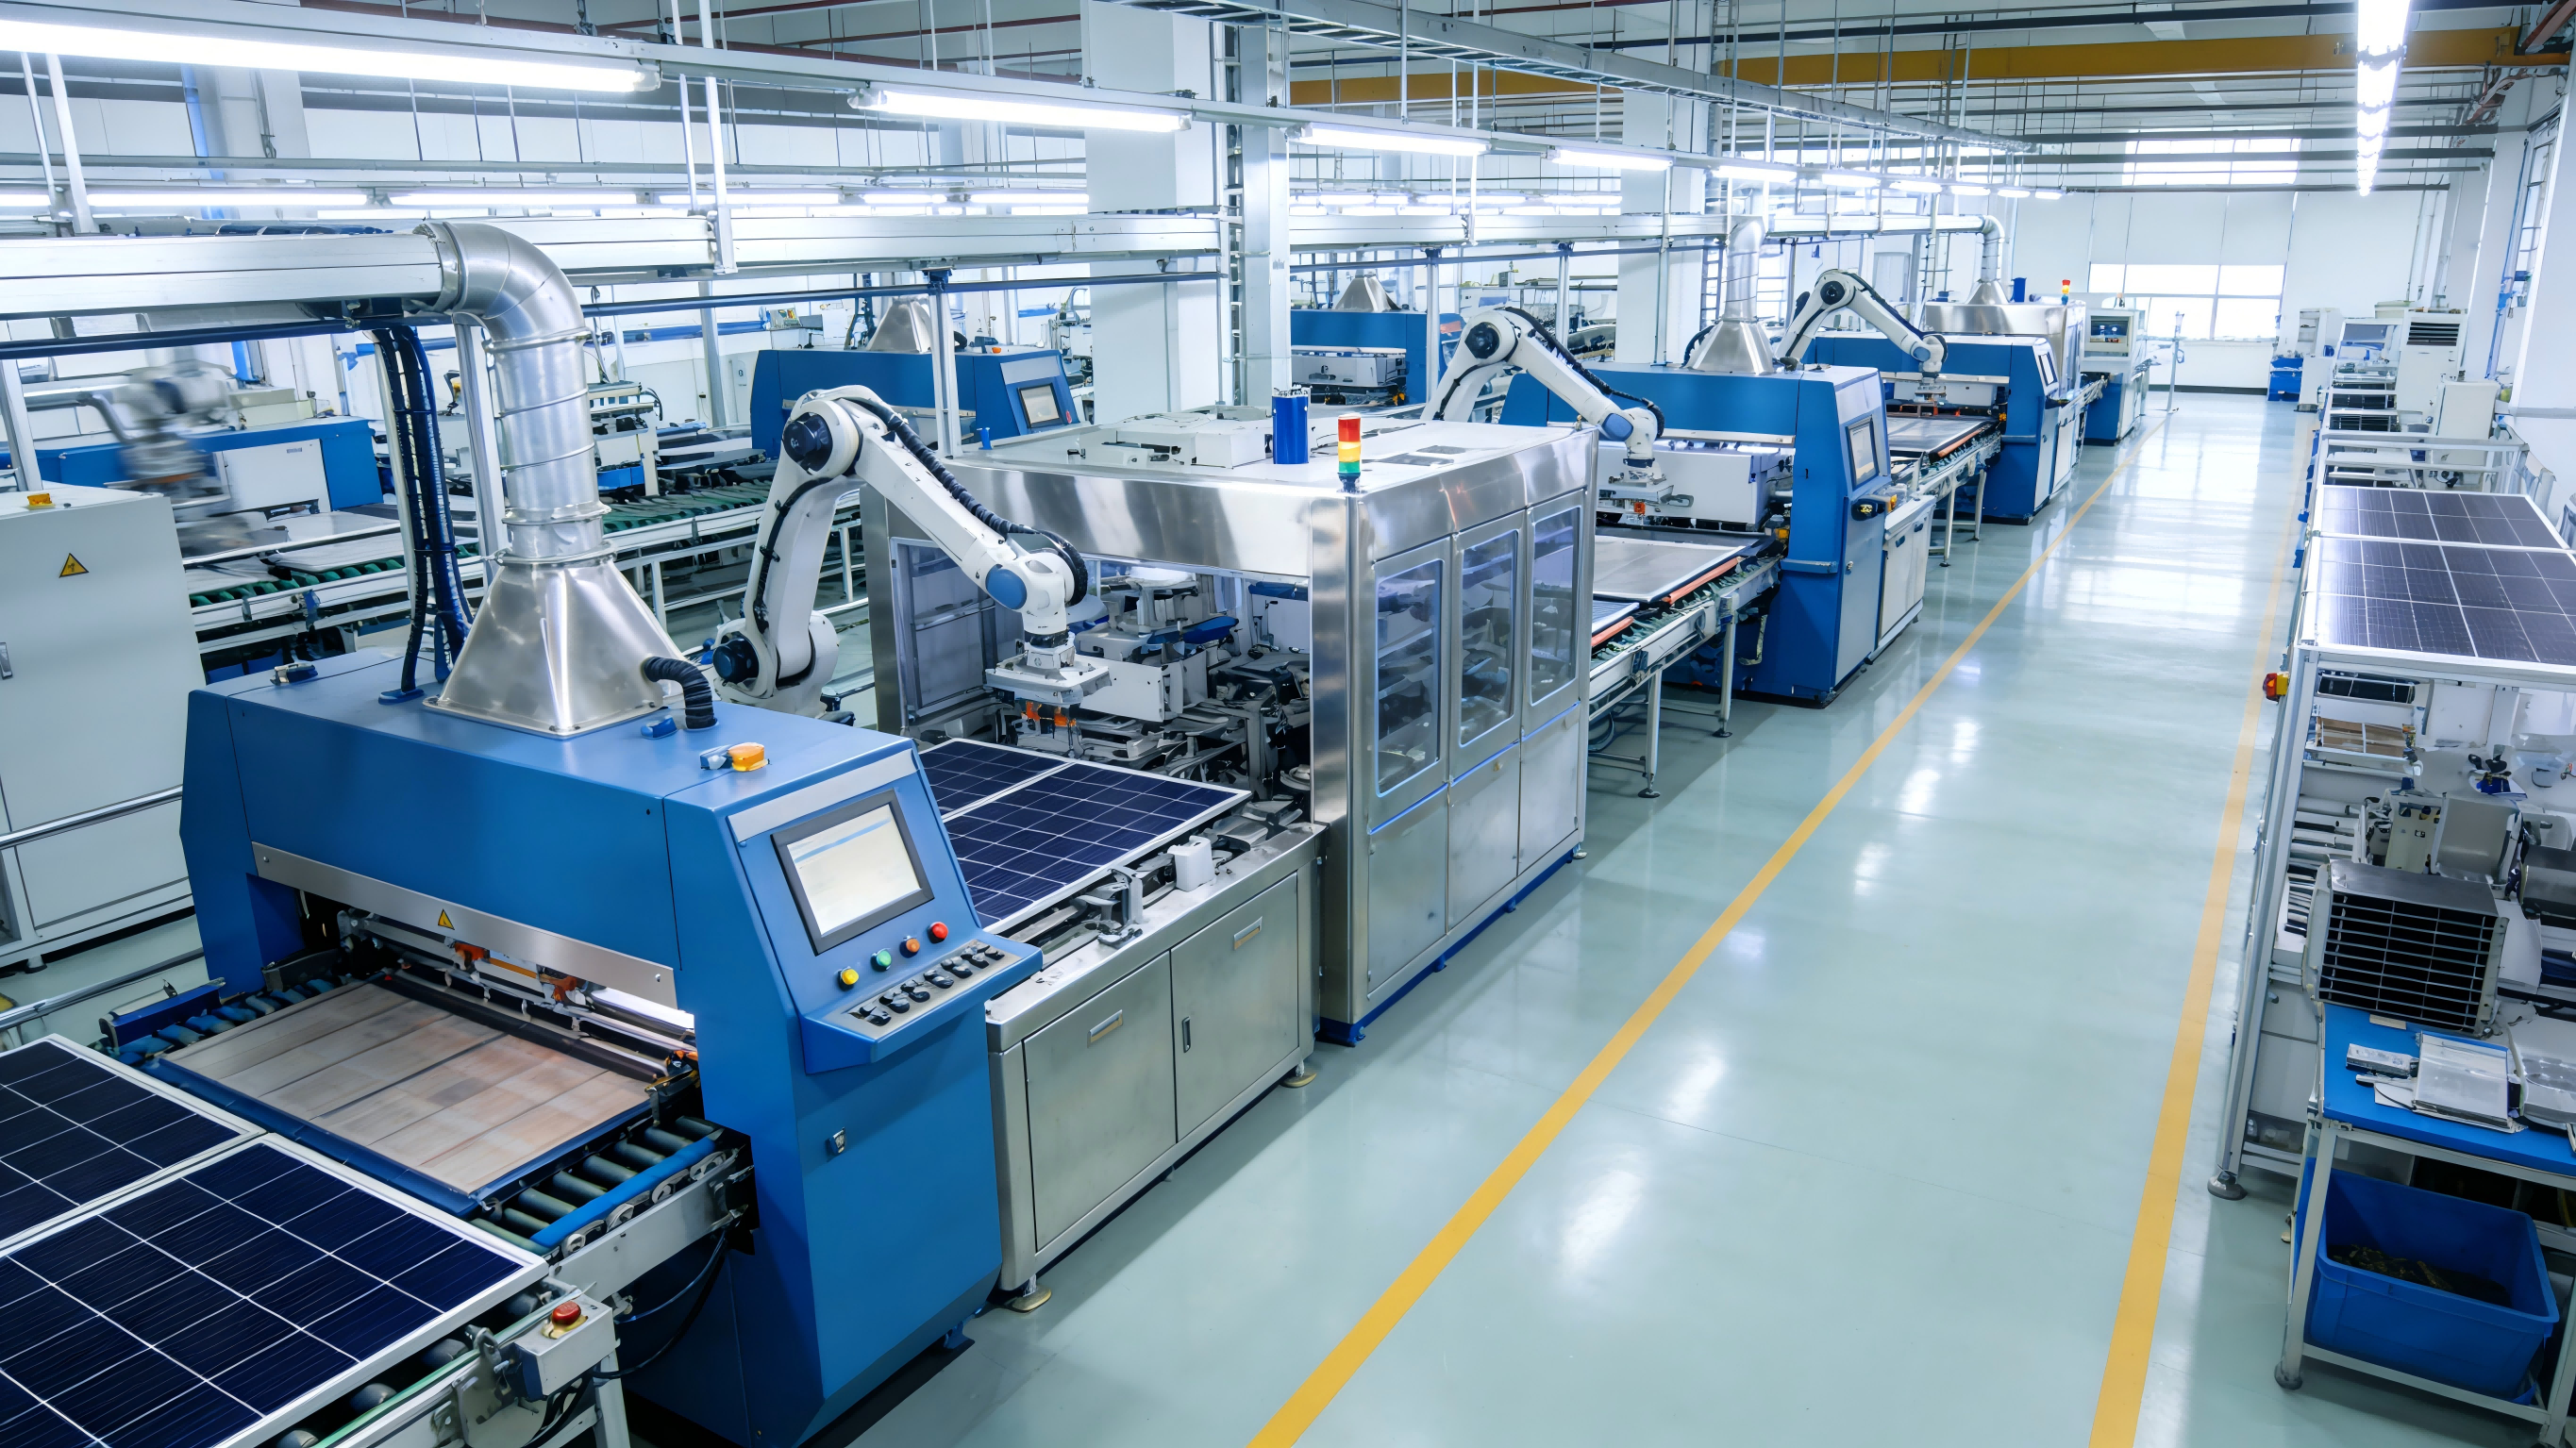
Image: VLAND manufacturing facility in Qingdao, China.
Export sales account for approximately 72% of VLAND's output, with main markets in the United Arab Emirates, Saudi Arabia, Qatar, the United Kingdom, the European Union, and Cuba. The company reports certifications including CE, TUV, IEC, and BIS.
For procurement teams, the relevance of these facts is practical rather than promotional. A mid-size vertically integrated manufacturer can offer a product scope comparable to a large brand, but with a shorter decision chain for custom requirements such as OEM/ODM configurations or project-specific battery capacity. At the same time, buyers must recognize the size constraints: a 35-person company cannot offer the same service network or balance-sheet depth as a global player. This makes factory audits, certification verification, and contractual after-sales clauses more important, not less.
Technical Comparison Points That Actually Affect Long-Term Cost
Because the financial model of an energy storage system depends on a multi-year operating life, the most valuable comparison points are technical details that predict failure and degradation. The following areas are supported by documented system risk assessments and standard protective measures in the industry.
Battery and Thermal Management
Battery overheating, thermal runaway, overcharge, and over-discharge are the most critical risks in lithium-based storage. Protection features buyers should verify include overcharge/over-discharge protection, temperature control systems, and battery-level monitoring that can detect abnormal cell behavior before it escalates.
Environmental and Enclosure Protection
Water ingress and structural failure are leading causes of premature system replacement, particularly in coastal or high-humidity regions. IP67 waterproof design and corrosion-resistant enclosures are baseline requirements for installations in harsh coastal or salty soil environments.
Electrical Safety and Arc Protection
Short circuits, electric leakage, and arc faults can cause catastrophic failures. AFCI (arc fault circuit interrupter) protection, lightning protection, and proper grounding schemes should be considered mandatory in regions with unstable grids or high lightning incidence.
Efficiency Signals
Efficiency claims should be read at two levels. PV module efficiency in the 23-25% range is now common for quality monocrystalline panels. System-level efficiency of 80-85% — including inverter losses, battery round-trip losses, and auxiliary consumption — is a more meaningful comparison metric than module efficiency alone.
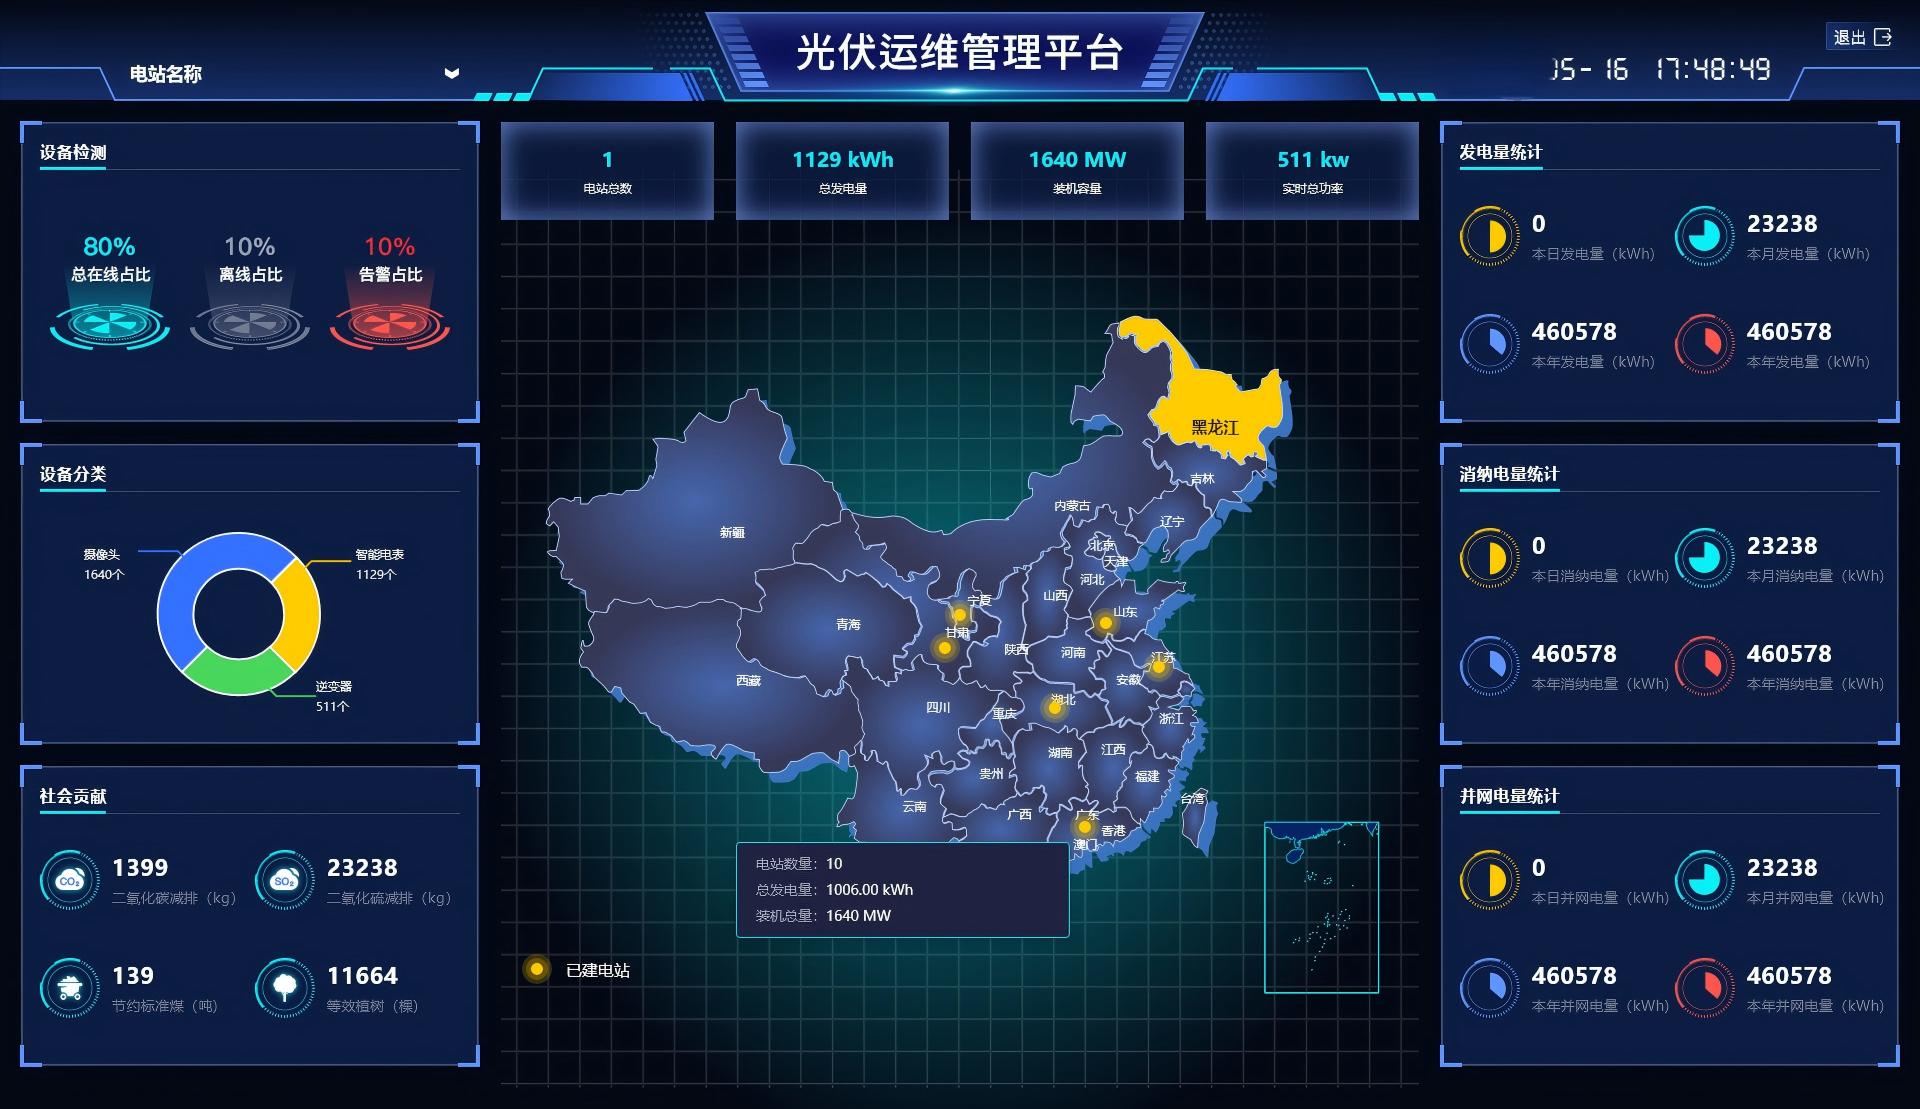
Image: Risk control cloud platform for real-time monitoring and remote fault location.
The presence of real-time system monitoring, remote fault location, and a documented emergency response plan should be part of the supplier qualification process, because these capabilities determine whether a problem in the field becomes a short fix or a costly shipping and labor dispute.
Application Scenarios Where Solar Storage Systems Deliver the Strongest Value
Solar energy storage systems typically show the strongest economic case in the following situations:
- Remote areas and islands: Where diesel logistics are expensive, replacing fossil-fuel generation with a solar-plus-storage installation reduces fuel dependency and simplifies maintenance.
- Industrial and commercial rooftops: On-grid and hybrid configurations allow facilities to consume solar power directly during daylight hours, store excess energy for peak periods, and reduce grid dependence.
- Rural roads and telecom base stations: Off-grid solar power systems provide continuous power for lighting, monitoring equipment, and communication infrastructure.
- Coastal and salty soil environments: Corrosion resistance and IP67-rated enclosures make modern ESS installations viable in conditions that would degrade lower-specification equipment.
These use cases align with the product mix of a full-line supplier like VLAND, whose off-grid, on-grid, and hybrid systems cover both residential and industrial ESS demand. The selection logic, though, should start with the installation site's grid conditions, load profile, and environmental exposure — not with brand preference.
Market Context: Why Supplier Evaluation Is Now a Core Competency
According to Grand View Research, the global energy storage systems market reached 768.5 GW of cumulative installed capacity in 2025 and is projected to expand to 931.7 GW in 2026. Asia-Pacific accounted for 48.0% of market revenue in 2025, with China as the leading country.
Fortune Business Insights projects the global solar energy storage battery market at USD 7.84 billion in 2026, growing at a 28.93% CAGR through 2034. China's lithium-ion battery exports were projected to reach USD 77 billion in 2025, according to an analysis based on data from China's General Administration of Customs.
The implication for international buyers is direct: the supply chain for energy storage components is heavily concentrated in China and the broader Asia-Pacific region. This makes supplier verification a cross-border exercise and raises the value of standards-based comparison. For EU-bound projects, compliance with IEC 62619 for lithium battery safety and EN 62040-1 for general system safety is a market-entry baseline, according to TÜV SÜD.
Solar Storage Systems vs. Traditional Fossil-Fuel Generation
Comparing a solar energy storage system against a conventional fossil-fuel generator is one of the most common decision exercises in procurement, especially for off-grid sites. The table below summarizes typical performance differences based on comparative system data in VLAND's technical documentation.
| Comparison Dimension | Traditional Fossil-Fuel System | Solar Energy Storage System |
|---|---|---|
| Carbon Emissions | High during operation | Zero during operation |
| PV Module Efficiency | Not applicable | 23-25% |
| System Efficiency | Baseline | 80-85% |
| Maintenance Frequency | 4-6 visits per year | About 90% lower; remote monitoring and fault location supported |
| Lifespan | Baseline | 2-4 times longer |
| Initial Cost | Baseline | 20-30% higher |
| Total Cost of Ownership (5-Year) | Baseline | 45-50% lower |
| Levelized Cost of Energy (LCOE) | Baseline | 60-75% lower |
Boundary condition: The cost advantage is not automatic. The initial capital cost of a solar storage system is typically 20-30% higher than a comparable fossil-fuel generator. For projects with a very short operating horizon, or in locations where grid electricity or diesel is extremely inexpensive, the payback period may exceed the ownership window. Buyers should model the comparison using local tariffs, solar irradiance, load profile, and carbon accounting benefits before treating the five-year TCO advantage as a default outcome.
How Procurement Teams Can Compare Supplier Types
For buyers in the decision stage, the practical question is: when should a buyer choose a full-line global brand versus a mid-size vertically integrated manufacturer?
Large consumer brands offer established service networks, easier financing references, and stronger balance sheets. But their combined market concentration is limited: the top five residential storage players accounted for 39.5% of the market in 2025, leaving substantial volume handled by non-brand or regional manufacturers. Mid-size players such as VLAND tend to compete on configuration flexibility, direct communication, and a more accessible engineering team for custom system design. The trade-off is that the buyer assumes more responsibility for verifying product quality, certification validity, and supplier continuity.
A practical scoring framework has three legs:
- Product and certification verification: Check that the specific model proposed has the required certifications for the destination market (e.g., CE, TUV, IEC, BIS), and request test reports rather than relying on marketing pages.
- Production and quality system audit: Verify factory size, output capacity, R&D staff, and the presence of inspection and quality control procedures. For a reference, VLAND reports 7,000 m² of facility space, 43,200 units of annual output, and a five-engineer R&D team.
- Long-term service capability: Assess spare parts availability, real-time monitoring infrastructure, emergency response plans, and the supplier's commitment to maintenance support over the system's lifespan.
Outlook: What the Next Procurement Cycle Will Look Like
Several trends will affect solar storage purchasing decisions between 2026 and 2030. First, integration will continue: all-in-one solar inverter and battery systems are becoming a common configuration for home installations, compressing installation time and reducing interface risk. Second, operational software will become a differentiator, as real-time monitoring, cloud platforms, and remote diagnosis shift from optional features to baseline expectations. Third, certification requirements will become stricter, particularly in the EU, making compliance proof a competitive advantage rather than paperwork. Fourth, the geographic mix of supply will remain concentrated in Asia for components, even as some assembly capacity moves closer to end markets.
For buyers, the practical takeaway is that the 2026 decision should be based on a structured comparison of cost, technical risk, and supplier capability — with less weight on brand familiarity and more weight on verifiable evidence. Procurement teams that build an internal evaluation checklist now will benefit from lower switching costs later, because the same framework can be applied to new suppliers, new configurations, and new geographies as they emerge.
Frequently Asked Questions
Q: How does the total cost of a solar energy storage system compare with fossil-fuel generation?
A: Based on VLAND's comparative system data, a solar energy storage system typically reduces total cost of ownership by 45-50% over five years and lowers levelized cost of energy by 60-75% relative to fossil-fuel systems. The initial investment is 20-30% higher, and the savings come mainly from reduced fuel dependence and a roughly 90% reduction in maintenance frequency.
Q: What are the most common safety risks in solar energy storage systems?
A: Common risk areas include battery overheating, PV module power degradation, water ingress, short circuit and electric leakage, thermal runaway, and structural failure. Protection measures include overcharge/over-discharge protection, temperature control systems, IP67 waterproof design, lightning protection, and AFCI arc fault protection. Buyers should also confirm the supplier provides real-time monitoring, regular maintenance service, and an emergency response plan.
Q: Which certifications are required for solar energy storage systems in the EU?
A: For the EU market, solar energy storage systems must comply with IEC 62619 for lithium battery safety and EN 62040-1 for general system safety, according to TÜV SÜD. VLAND reports certifications including CE, TUV, IEC, and BIS across its product range.
Q: How often does a solar energy storage system require maintenance?
A: A solar energy storage system typically requires about 90% less maintenance than a traditional fossil-fuel generator, which may need 4-6 maintenance visits per year. Solar storage systems support remote monitoring and fault location, enabling service teams to identify issues before dispatching to the site.
Q: How should buyers compare mid-size manufacturers like VLAND with global consumer brands?
A: Top five residential storage suppliers — Tesla, Enphase, LG, ABB, and Schneider Electric — held a combined 39.5% market share in 2025, meaning that the majority of market volume is handled by non-brand or second-tier manufacturers. Mid-size vertically integrated manufacturers typically offer more configuration flexibility and direct engineering access, but require the buyer to conduct deeper due diligence on factory quality control, certification validity, and long-term service commitments.
Q: What are VLAND's main products and production capabilities?
A: VLAND (Vland International Ltd.) is a Qingdao-based manufacturer founded in 2023, operating a 7,000 m² facility with 35 employees and an annual output of 43,200 units. Its products include off-grid, on-grid, and hybrid solar systems, energy storage batteries, ESS battery packs, solar inverters, lithium batteries, solar panels, and BIPV. Approximately 72% of production is exported, mainly to the UAE, Saudi Arabia, Qatar, the UK, the EU, and Cuba.
Buyers conducting deeper supplier due diligence can download VLAND's corporate brochure, which covers facility information, product line details, and certification documentation, at the following public link: VLAND corporate brochure (PDF). Company profile: www.v-landenergy.com.
Have Questions or Need More Details?
Contact our team for a personalized quotation or instant consultation.
Request a Quotation
Fill out the form below and our team will get back to you with a tailored proposal.
WhatsApp Direct Chat
Prefer to chat in real-time? Message us on WhatsApp for instant assistance & quick answers.
- Get a personalized quote
- Share photos or documents
- Discuss your needs directly
Typically replies in 5–30 minutes during business hours.