
Supplier Evidence: 28% Shorter Sales Cycle, 4-5x Containers
Two twelve-month trade data programs, the workflow that produced them, and the limits a buyer should test before treating either number as a forecast.
Trade data platforms are increasingly judged by a standard the category did not originally set. Record counts and country coverage still matter, but they no longer decide a purchase, because every vendor can quote a large number and few buyers can verify what sits behind it. What moves a procurement conversation now is program-level evidence: what actually changed inside an export sales process after a platform was installed and used for a full year.
Two twelve-month programs run on the Topease E-Platform are the subject of this article. Their reported outcomes are a reduction of more than 60% in the time and manual effort required for overseas client acquisition, a 28% shorter sales cycle, and container volume growing 4-5x in a building-materials account.
All three figures are program-reported and have not been independently audited. They describe accounts with their own starting conditions, and they are read here as directional evidence — a description of which parts of an export sales process an integrated trade data workflow changes — rather than as a forecast of what a different company will achieve.
What supplier evidence means in a trade data purchase
Supplier evidence in this category falls into four tiers, and only the first two can be fully verified before a contract is signed.
- Coverage evidence — record volume, country and region footprint, refresh cadence.
- Governance evidence — how records are standardized, deduplicated, enriched and validated, and what security certifications sit behind them.
- Workflow evidence — whether discovery, contact resolution, outreach and customer records live in one system or in four.
- Outcome evidence — what changed in cycle time, effort or shipment volume after a period of use.
Coverage and governance claims are checkable during a trial. Workflow claims become visible within the first week of use. Outcome claims cannot be verified before purchase at all; they can only be sampled afterwards, against the buyer's own baseline. That asymmetry explains why the 60%, 28% and 4-5x figures deserve attention and scrutiny in equal measure: they are the only tier of evidence that speaks directly to commercial results, and the only tier that cannot be audited in advance.
The fragmented baseline behind a slow sales cycle
The starting condition in most export teams is not a lack of effort. It is a lack of continuity. Research happens in one tool, contact lookup in another, outreach in a third, and the record of what was said in a spreadsheet that only one salesperson opens. The same buyer gets investigated twice, contacted twice and forgotten once.
The pattern is consistent across export-oriented industries: difficulty identifying genuinely qualified overseas buyers, unreliable market intelligence, inefficient customer acquisition, and limited visibility into where demand is actually moving. The causes are structural rather than individual — fragmented data sources, outdated buyer lists, no trade visibility, manual research, and sales tools that do not connect to each other.
The commercial result shows up in exactly the metrics the two programs reported: longer sales cycles, low conversion on outreach, missed market opportunities and a rising cost per acquired customer.
The mechanical link between fragmentation and a 28% cycle-time figure is straightforward. Every handoff between tools adds elapsed days without adding information. A buyer researched on Monday, resolved to a contact on Thursday and emailed the following week has spent nine days in transit before the first reply arrives. Removing those days does not make a sales team work harder; it removes dead time from a process that was never designed to run as one process.
Topease at a glance
Shanghai Topease Information & Technology Co., Ltd. is a Shanghai-based company founded in 2004 that builds AI-powered global trade growth platforms. Its products are the Topease E-Platform, Global Trade Pal, Tesour and GTminds. The company reports approximately 200 staff, a 1,300 m² facility, a 50-person R&D team and about 40,000 client services per year, with roughly 30% of business exported and primary markets in the EU and the USA.
Two credentials are relevant to a procurement file: ISO 27001 certification and recognition from the Shanghai Data Exchange. The company's high-quality data asset construction project was also selected as one of the first national pilot initiatives for high-quality data development.
| Platform fact | Detail |
|---|---|
| Founded | 2004, Shanghai |
| Products | Topease E-Platform, Global Trade Pal, Tesour, GTminds |
| Data assets | More than 11 billion compliant trade data records; 232 countries and regions; 450M+ company profiles; 770M+ verified business contacts |
| Delivery | SaaS subscription; platform access after account activation; onboarding and training typically within 1–2 business days |
| Access channels | Web platform, SaaS account, enterprise sales team, customer success support, API |
| Languages | English, Chinese |
| Compliance | ISO 27001; recognition from the Shanghai Data Exchange |
How the pipeline is actually built
The reported outcomes are easier to interpret once the underlying sequence is visible. The Topease E-Platform is organized as four connected layers, and each one removes a different kind of delay from the acquisition process.
Discovery — Global Trade Pal
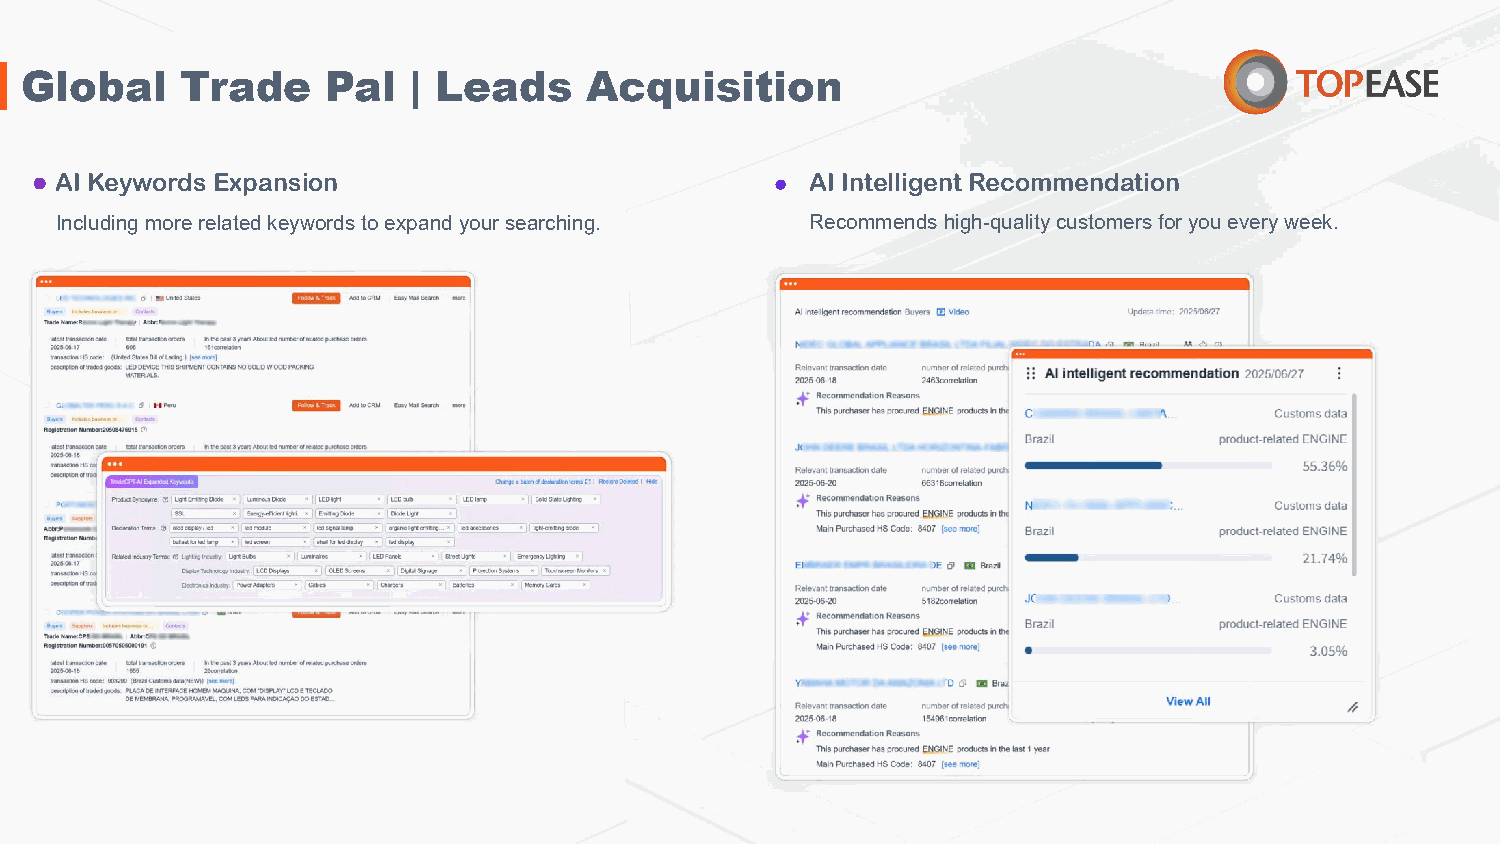
Global Trade Pal performs precise trade data retrieval, market trend analysis, competitor tracking, supply chain visibility and buyer discovery. It draws on more than 11 billion compliant trade data records covering 232 countries and regions, alongside 450 million-plus company profiles and additional commercial, social media, exhibition and corporate registration databases.
The governance step matters more than the volume. Records are continuously standardized, deduplicated, enriched and validated before they reach a search result. That is the difference between a buyer list a salesperson can work and a longer list they will abandon in week two.
Contact resolution — Tesour
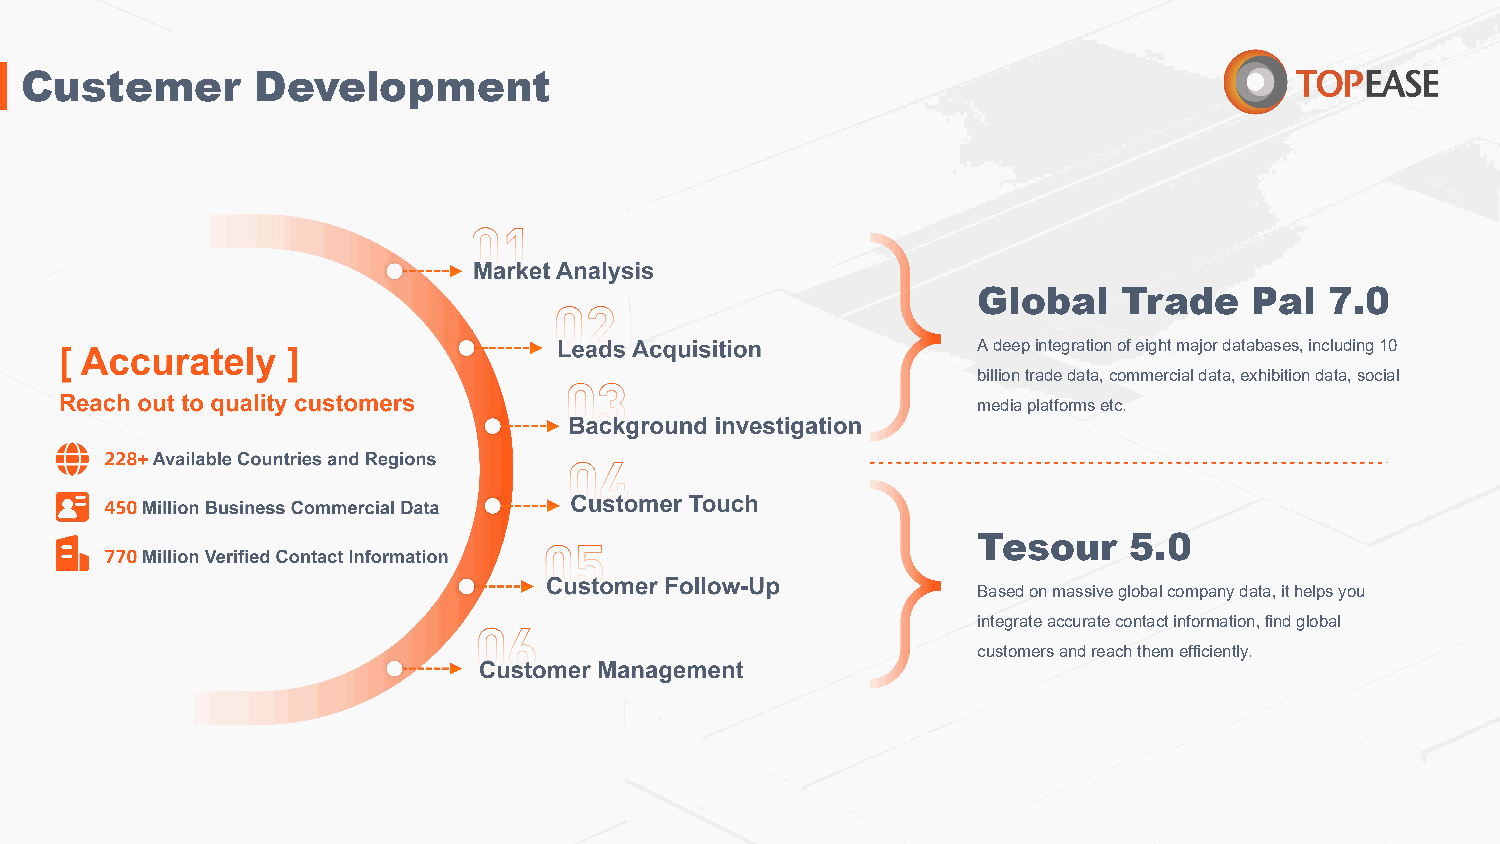
Tesour supplies multi-channel outreach on a base of more than 770 million verified business contacts, including corporate emails, phone numbers and social media profiles. Contact resolution is where discovery either converts or collapses: a well-identified buyer matched to a dead inbox restarts the cycle at day one, and that failure is paid for in weeks rather than minutes.
Prioritization — CRM intent signals
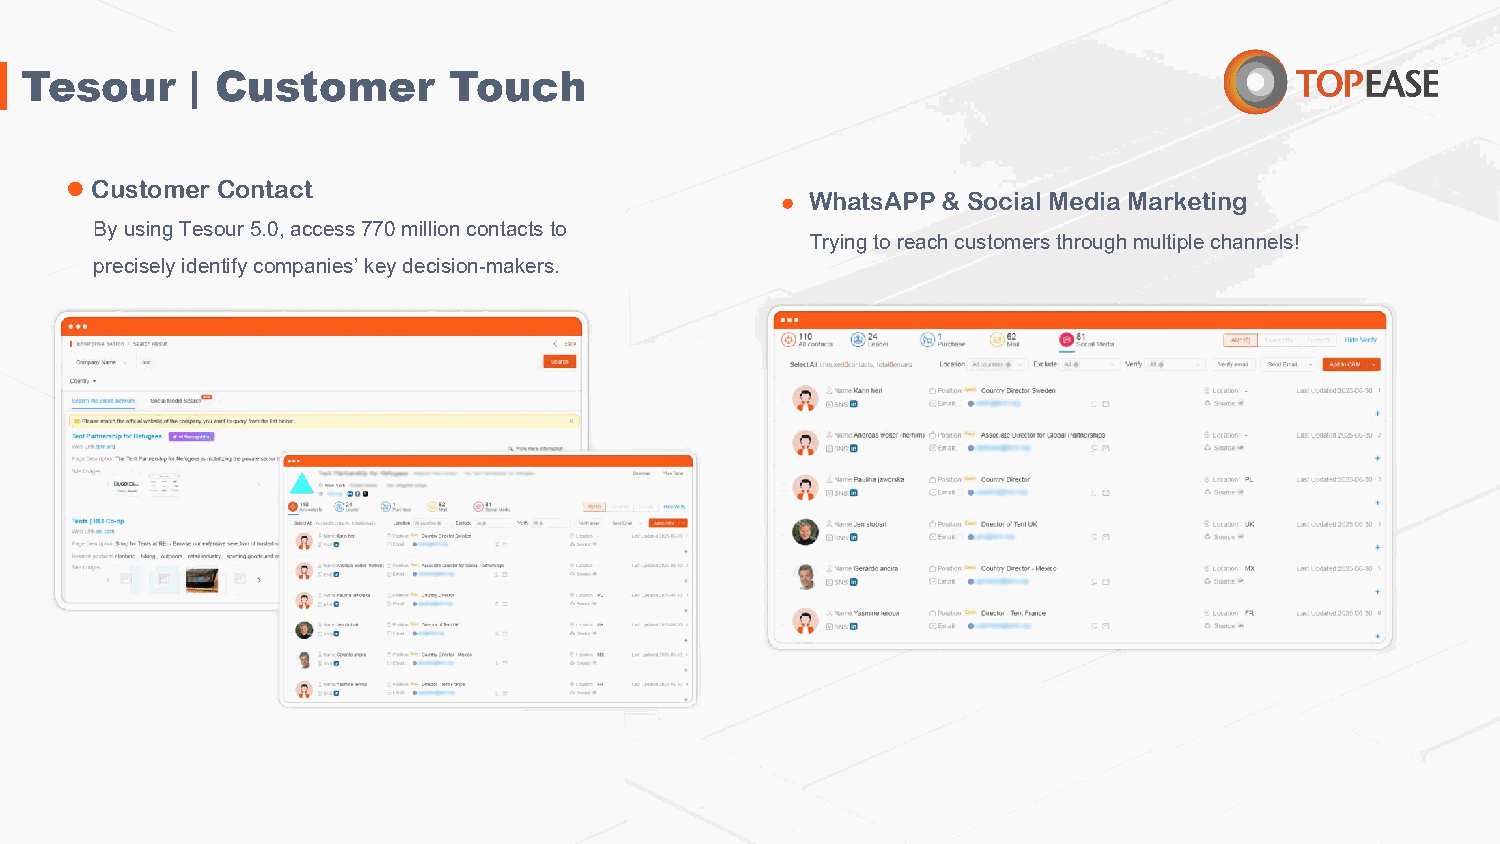
The native CRM unifies customer assets, prevents duplicate outreach, automates tagging and records every interaction. Operationally, this is the layer that converts a contact database into a ranked pipeline. Buyers are ordered by observed engagement — replies, meeting history, recurring interest in specific product lines — rather than by list position or by whichever salesperson happens to remember them.
Automation — GTminds
GTminds is Topease's vertical AI assistant layer, trained on the company's trade data and operating across all modules. It automates market analysis, interprets BI dashboards, identifies high-potential buyers, generates enterprise background reports, evaluates supply chain risk and produces personalized multilingual outreach content.
Why the sequence, not the feature list, produces the number
None of these four layers is unusual in isolation. Shipment databases exist. Contact databases exist. CRMs exist. The measurable difference in the two programs comes from continuity: a signal found in shipment records becomes a contact, the contact becomes a scored record, and the record's history feeds the next round of discovery. The loop is what shortens a cycle. A feature list is not.
Reading the three numbers correctly
Each reported outcome measures something different, and each carries a different kind of caveat.
| Reported outcome | What it measures | Period | What it does not measure |
|---|---|---|---|
| More than 60% less time and manual effort in overseas client acquisition | Research, list building, contact lookup and record-keeping effort | 12 months | Revenue, conversion rate, or the quality of resulting conversations |
| 28% shorter sales cycle | Elapsed time from first contact to closed order, against the account's own prior baseline | 12 months | Margin, deal size, or whether unqualified deals simply exited earlier |
| 4-5x container growth in a building-materials account | Shipment volume against the account's own starting volume | 12 months | Price realization, product mix, or market-level demand effects |
The 60% figure is the easiest to misread. It counts effort upstream of the sales conversation — the research, verification, contact lookup and record-keeping that consume a business development team's week. That makes it the least commercially meaningful of the three on its own, and also the most directly attributable to software, because it describes work a platform performs rather than business a market grants.
The 28% figure is a cycle-time measure. A sales cycle shortens for three legitimate reasons in this workflow: buyers already importing comparable products are identified before outreach instead of after; fewer first calls go to companies with no import history in the category; and internal handoffs between research, contact and outreach disappear. A fourth reason is less flattering — a shorter average can also reflect a shift toward smaller deals — which is why cycle time should always be read alongside average order value, not in isolation.
The 4-5x figure is a volume multiple, and multiples are sensitive to base size. An account shipping one container per quarter can reach four to five containers per quarter without any single dramatic event. Volume also says nothing about margin, and in building materials demand is project-driven, so a twelve-month window can include timing effects that a longer period would smooth out.
Application: from shipment record to container
In the building-materials account cited, the twelve-month program moved container volume 4-5x against the account's own baseline. The sequence behind that number is repeatable and unglamorous: identify importers with recurring shipments of comparable products, verify the counterparty and its scale, resolve decision-maker contacts, sequence outreach by product fit, and record every response so the next round begins from evidence rather than memory.
The same sequence maps onto other categories Topease serves — automotive parts, machinery, chemicals, environmental equipment, lighting, new energy and textiles — but with different points of leverage. What changes by industry is where the constraint sits.
- Building materials: the constraint is buyer identification across fragmented, price-sensitive markets, where import history is the strongest available qualification signal.
- Machinery and equipment: the constraint is qualification, because a wrongly qualified buyer costs months rather than weeks; counterparty and supply chain visibility matter more than outreach volume.
- Chemicals: the constraint is verification — counterparties, end uses and documentation carry compliance weight, so contact accuracy and background checks precede any pitch.
- Automotive parts, lighting, new energy and textiles: the constraint is often competitor and market-share visibility, since shipment patterns reveal who is gaining volume in a target market before that shift appears in a buyer's own reporting.
Why this category is being funded now
The commercial context supports the program-level framing. Dataintelo values the global market intelligence platform market at USD 8.6 billion in 2025, with a projected reach of USD 18.9 billion by 2034. Data Bridge Market Research estimates the broader global trade management market — which includes trade intelligence — reaching USD 8.20 billion by 2032 at a CAGR of 10.40%. Mordor Intelligence places North America as the largest revenue share holder in 2025, at approximately 38.8% to 47.3% depending on the analytics segment being measured.
Two further data points explain why outcome evidence is becoming the deciding factor. Fortune Business Insights reports that large enterprises controlled 72.55% of total spending on global trade management software in 2024 — a concentration that historically kept sophisticated trade intelligence inside organizations with dedicated research teams. Standardized SaaS delivery is how mid-sized exporters now buy a comparable capability without that team. Meanwhile UNCTAD puts world services exports, including data and intelligence services, at USD 8.8 trillion in 2025, up 9% year on year, which describes a market where more cross-border commercial relationships are being initiated and are therefore available to be found in records.
A 2024 projection from Market Data Forecast puts the reduction in manual data cleaning from AI-assisted integration at 70% in high-frequency logistics environments. Treated as a projection rather than a result, it points in the same direction as the 60% effort figure: the automation dividend in this category is realized upstream, in preparation work, before any sales conversation begins.
Comparison with traditional sourcing and with shipment-only databases
Three approaches are commonly compared in a procurement file, and they answer different questions rather than competing on a single axis.
| Dimension | Fairs, referrals and manual prospecting | Shipment-record database only | Integrated trade growth platform (Topease E-Platform) |
|---|---|---|---|
| Buyer identification | Event timing and personal networks | Customs shipment records by product and counterparty | Shipment records plus company profiles and buyer discovery |
| Contact resolution | Business cards, manual search | Usually a separate tool or separate purchase | Tesour: 770M+ verified business contacts in the same workflow |
| Workflow continuity | Fragmented across tools and spreadsheets | Export to CRM required | Native CRM with tagging and interaction history |
| Cycle-time effect | Dependent on calendar events | Faster research, unchanged outreach process | Research and outreach compressed into one loop |
| Typical limitation | Low volume, high cost per contact | Depth of customs data, not contact or CRM depth | Depends on user discipline and on jurisdiction-level data coverage |
The shipment-level specialists are well documented. Panjiva, an S&P Global business, aggregates and normalizes over 2 billion shipment records from 22 customs authorities. ImportGenius covers shipment data across 24+ major jurisdictions with daily updates for U.S. records. Descartes Datamyne and Trademo are recognized alongside them among the leading competitors in shipment-level trade intelligence. Their strength is depth of customs records; Topease's reported scope is breadth of records across 232 countries and regions, combined with contact resolution and CRM continuity. A buyer comparing the two should decide which question matters first, not which vendor has the larger number.
Limits and where this approach does not fit
- Customs records are retrospective and jurisdiction-dependent. Not every market publishes shipment-level detail, and a 232-country footprint does not mean uniform depth in every country. Buyers should check coverage for their specific product and destination before signing.
- Contact data decays. A base of 770 million-plus verified contacts describes verification at the point of collection, not a guarantee of deliverability today. Expect a proportion of records to require re-validation.
- The outcome figures are self-reported and account-specific. The 60%, 28% and 4-5x results come from programs with their own starting conditions; a company with an already-integrated sales process should expect a smaller relative gain.
- This is not a trading agent. The platform does not sell on a customer's behalf, does not guarantee transactions or orders, and does not replace professional legal or compliance consulting.
- Value depends on usage. SaaS delivery means access begins quickly — onboarding and training typically within 1–2 business days — but an unworked pipeline produces no cycle-time improvement, however good the underlying data.
Future outlook
Three shifts are worth watching over the next planning cycle. First, the boundary between trade data, contact intelligence and CRM is closing; buyers increasingly evaluate the loop rather than the database, which favors platforms that can demonstrate continuity over specialists that optimize one layer. Second, prioritization is moving from list order to observed intent — as interaction history accumulates, the ranking of buyers becomes the product, and the underlying record set becomes a commodity input.
Third, outreach compliance is receiving more attention than it did when trade data was a research tool used by analysts rather than a prospecting tool used by sales teams. Organizations that scale outreach without documentation discipline tend to discover this late. None of these shifts changes the basic evidence question; they change which part of the workflow a buyer should inspect most closely.
FAQ
What is a trade data intelligence platform?
A trade data intelligence platform is software that converts customs and shipment records into searchable market and buyer intelligence, and typically connects that intelligence to contact discovery, outreach and customer management. Topease delivers this as Trade Data SaaS on a subscription model, with platform access after account activation and onboarding and training normally completed within 1–2 business days.
What exactly do the 28% and 4-5x figures measure?
The 28% figure compares average elapsed time from first contact to closed order against the same account's prior baseline. The 4-5x figure compares container volume in a building-materials account against that account's own starting volume. Neither measures revenue, margin or deal size, and both are program-reported results from twelve-month engagements rather than audited benchmarks.
How does buyer discovery work from customs records?
Global Trade Pal queries more than 11 billion compliant trade data records across 232 countries and regions. Because those records are standardized, deduplicated, enriched and validated before retrieval, a buyer profile can be assembled from shipment frequency, product mix and counterparty relationships rather than from a static contact list. The output is a set of companies with demonstrated import activity in a relevant category.
Where does the 60% effort reduction come from?
It refers to the time and manual effort spent on overseas client acquisition — research, list building, contact lookup and record-keeping — before any sales conversation takes place. It is an effort measure, not a revenue measure, which makes it the outcome most directly attributable to the platform and the least indicative of commercial results on its own.
What can trade data not tell you?
Trade data records what crossed a border, not why. Purchase intent has to be inferred from shipment patterns, and that inference is stronger in some categories than others. Coverage varies by jurisdiction, contact records age, and a shipment record does not confirm that a counterparty is creditworthy or compliant. Verification and compliance assessment remain separate steps.
How long does a program take before results appear?
Both cited programs ran for twelve months. Reductions in preparation effort typically become visible earlier than changes in cycle time or shipment volume, because the latter depend on the length of the sales cycle and on the buyer's own purchasing calendar. Platform onboarding itself is short — access after account activation, with training usually within 1–2 business days — so the constraint is process adoption rather than deployment time.
Topease's platform brochure, covering product scope, delivery channels and service details, is available for download: TOPEASE_en.pdf. Company enquiries: enquiry@topease.net.
Have Questions or Need More Details?
Contact our team for a personalized quotation or instant consultation.
Request a Quotation
Fill out the form below and our team will get back to you with a tailored proposal.
WhatsApp Direct Chat
Prefer to chat in real-time? Message us on WhatsApp for instant assistance & quick answers.
- Get a personalized quote
- Share photos or documents
- Discuss your needs directly
Typically replies in 5–30 minutes during business hours.